Filters
▼Clonality
▼Type
▼Reactivity
▼Gene Name
▼Isotype
▼Host
▼Application
▼Clone
▼Monoclonal Antibodies
Get accurate results in your research with our Monoclonal Antibodies, which are specially made to target exactly what you require for your research, and will produce consistent, reliable performance in lab tests.
Viewing 4800-4850 of 27597 product results
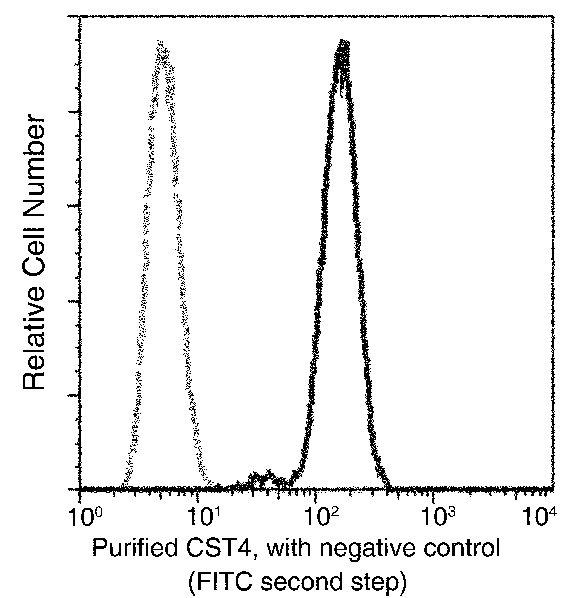 FCM/FACS (Flow Cytometry)
(Flow cytometric analysis of Human CST4 expression on HeLa cells. The cells were treated according to manufacturer's manual (BD Pharmingen'), stained with purified anti-Human CST4, then a FITC-conjugated second step antibody. The fluorescence histograms were derived from gated events with the forward and side light-scatter characteristics of intact cells.)
FCM/FACS (Flow Cytometry)
(Flow cytometric analysis of Human CST4 expression on HeLa cells. The cells were treated according to manufacturer's manual (BD Pharmingen'), stained with purified anti-Human CST4, then a FITC-conjugated second step antibody. The fluorescence histograms were derived from gated events with the forward and side light-scatter characteristics of intact cells.)
Cystatin S, Monoclonal Antibody (Cat# AAA255424)
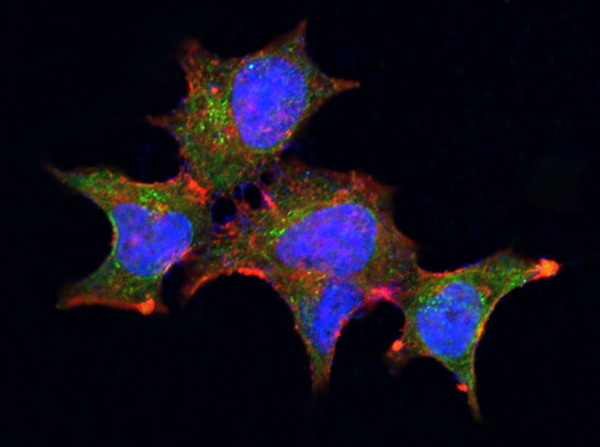 IF (Immunofluorescence)
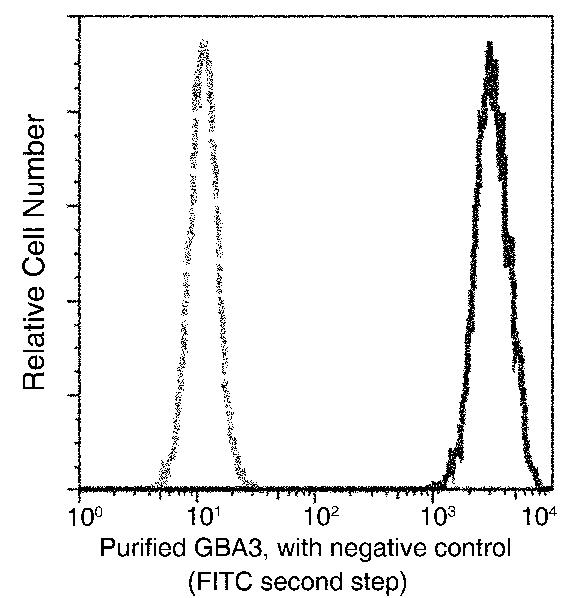
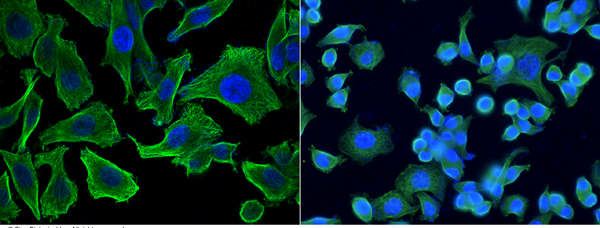
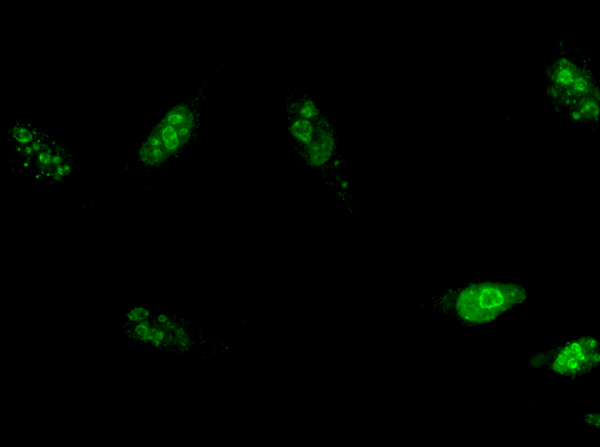
(Confocal immunofluorescence analysis of Human GBA3 in MCF7 cells. Cells were fixed with 4% PFA, permeabilzed with 1% Triton X-100 in PBS, blocked with 10% serum, and incubated with Rabbit anti-Human GBA3 monoclonal antibody (1:60). Then cells were stained with the Alexa Fluor 488-conjugated Goat Anti-rabbit IgG secondary antibody, countstained with Alexa Fluor 546-conjugated phallotoxins (red) and DAPI (blue). Positive staining was localized to cytoplasm.)
IF (Immunofluorescence)
(Confocal immunofluorescence analysis of Human GBA3 in MCF7 cells. Cells were fixed with 4% PFA, permeabilzed with 1% Triton X-100 in PBS, blocked with 10% serum, and incubated with Rabbit anti-Human GBA3 monoclonal antibody (1:60). Then cells were stained with the Alexa Fluor 488-conjugated Goat Anti-rabbit IgG secondary antibody, countstained with Alexa Fluor 546-conjugated phallotoxins (red) and DAPI (blue). Positive staining was localized to cytoplasm.)
GBA3, Monoclonal Antibody (Cat# AAA255431)
 FCM/FACS (Flow Cytometry)
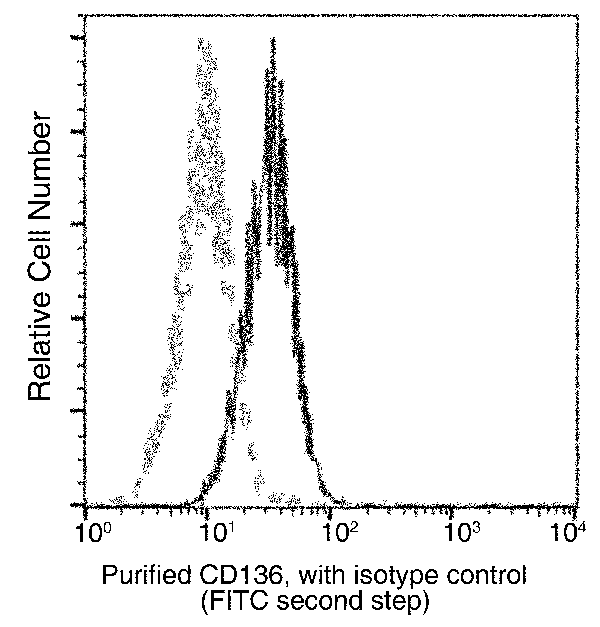
(Flow cytometric analysis of Human CD136 expression on SW480 cells. Cells were stained with purified anti-Human LILRA3(CD85e), then a FITC-conjugated second step antibody. The fluorescence histograms were derived from gated events with the forward and side light-scatter characteristics of intact cells)
FCM/FACS (Flow Cytometry)
(Flow cytometric analysis of Human CD136 expression on SW480 cells. Cells were stained with purified anti-Human LILRA3(CD85e), then a FITC-conjugated second step antibody. The fluorescence histograms were derived from gated events with the forward and side light-scatter characteristics of intact cells)
RON/CD136, Monoclonal Antibody (Cat# AAA255432)
 FCM/FACS (Flow Cytometry)
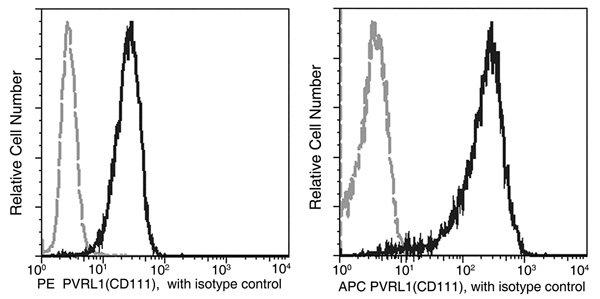
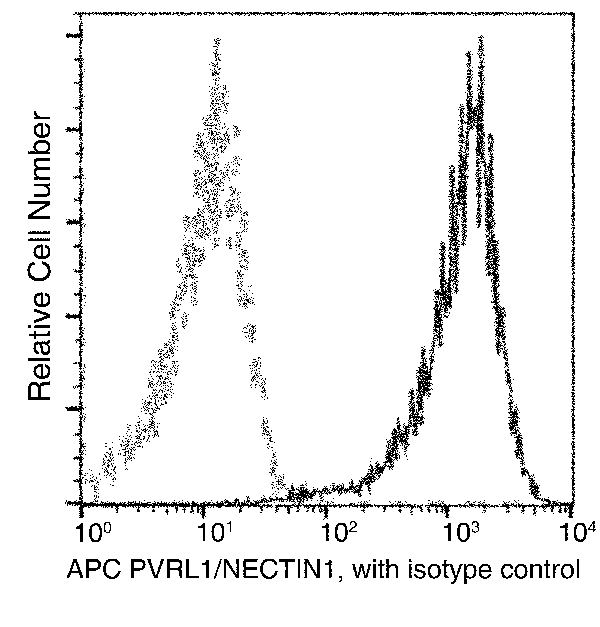
(Flow cytometric analysis of Human PVRL1(NECTIN1) expression on TF-1 cells. Cells were stained with APC-conjugated anti-Human PVRL1(NECTIN1). The fluorescence histograms were derived from gated events with the forward and side light-scatter characteristics of intact cells.)
FCM/FACS (Flow Cytometry)
(Flow cytometric analysis of Human PVRL1(NECTIN1) expression on TF-1 cells. Cells were stained with APC-conjugated anti-Human PVRL1(NECTIN1). The fluorescence histograms were derived from gated events with the forward and side light-scatter characteristics of intact cells.)
PVRL1/NECTIN1, Monoclonal Antibody (Cat# AAA255434)
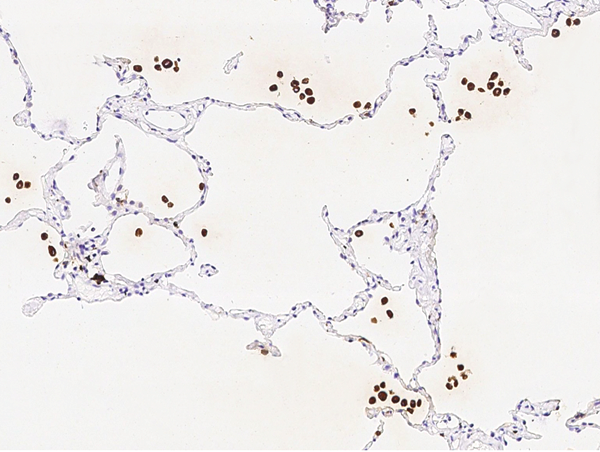
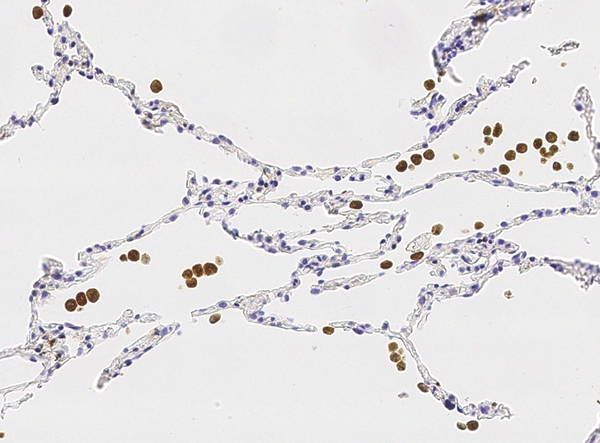
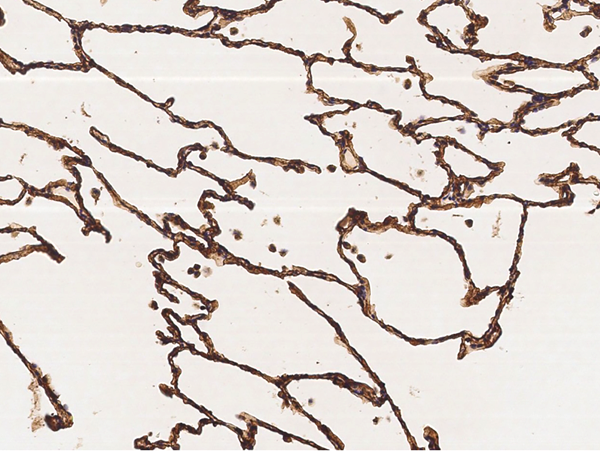 IHC (Immunohiostchemistry)
(Immunochemical staining of human AGER in human lung with mouse monoclonal antibody (1:1000, formalin-fixed paraffin embedded sections).)
IHC (Immunohiostchemistry)
(Immunochemical staining of human AGER in human lung with mouse monoclonal antibody (1:1000, formalin-fixed paraffin embedded sections).)
RAGE, Monoclonal Antibody (Cat# AAA255442)
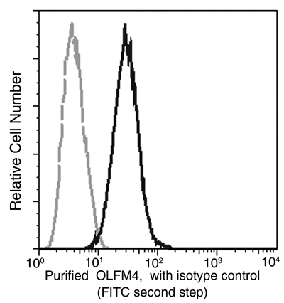 FCM/FACS (Flow Cytometry)
(Flow cytometric analysis of Human OLFM4 expression in DU145 cells. The cells were treated according to manufacturer's manual (BD Pharmingen'), and stained with Purified Mouse anti-OLFM4 (11639-MM12), then a FITC-conjugated second step antibody. The fluorescence histograms were derived from gated events with the forward and side light-scatter characteristics of intact cells.)
FCM/FACS (Flow Cytometry)
(Flow cytometric analysis of Human OLFM4 expression in DU145 cells. The cells were treated according to manufacturer's manual (BD Pharmingen'), and stained with Purified Mouse anti-OLFM4 (11639-MM12), then a FITC-conjugated second step antibody. The fluorescence histograms were derived from gated events with the forward and side light-scatter characteristics of intact cells.)
OLFM4, Monoclonal Antibody (Cat# AAA255445)

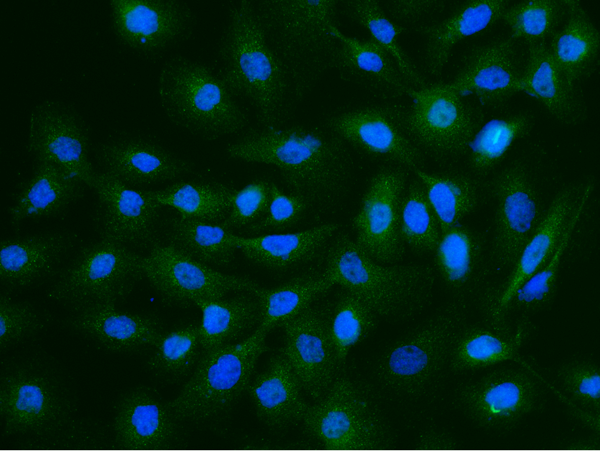
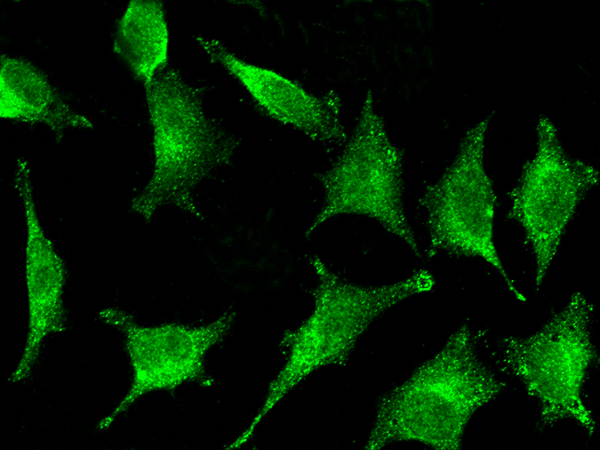
 IF (Immunofluorescence)
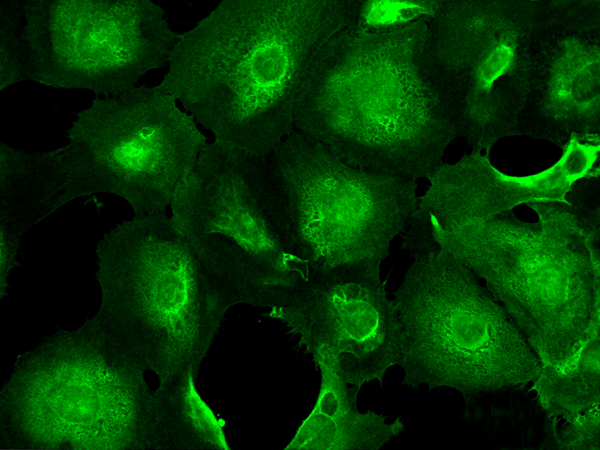
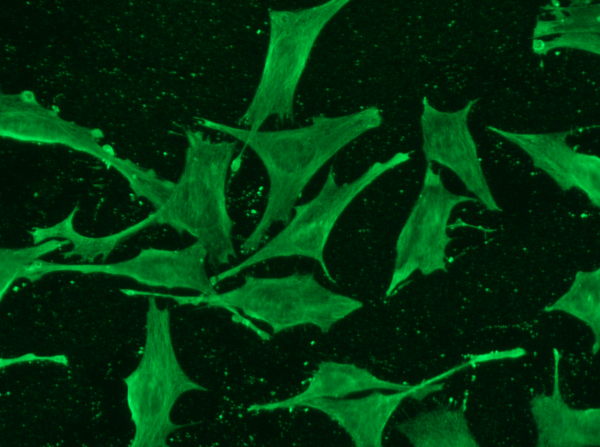
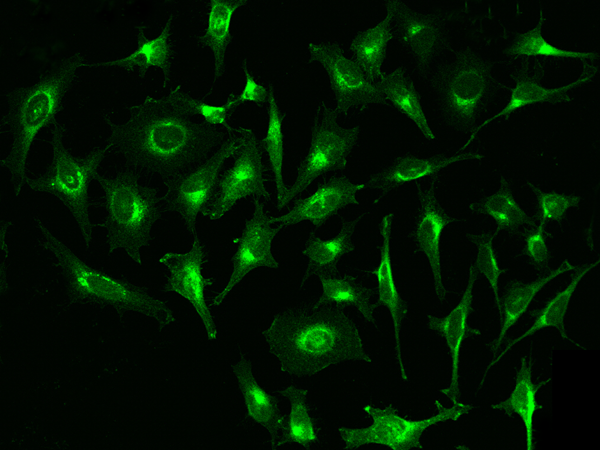
(Immunofluorescence staining of UCHL1 in DU145 cells. Cells were fixed with 4% PFA, permeabilzed with 0.1% Triton X-100 in PBS,blocked with 10% serum, and incubated with rabbit anti-human UCHL1 monoclonal antibody (dilution ratio 1:60) at 4 degree C overnight. Then cells were stained with the Alexa Fluor488-conjugated Goat Anti-rabbit IgG secondary antibody (green). Positive staining was localized to Cytoplasm.)
IF (Immunofluorescence)
(Immunofluorescence staining of UCHL1 in DU145 cells. Cells were fixed with 4% PFA, permeabilzed with 0.1% Triton X-100 in PBS,blocked with 10% serum, and incubated with rabbit anti-human UCHL1 monoclonal antibody (dilution ratio 1:60) at 4 degree C overnight. Then cells were stained with the Alexa Fluor488-conjugated Goat Anti-rabbit IgG secondary antibody (green). Positive staining was localized to Cytoplasm.)
UCHL1, Monoclonal Antibody (Cat# AAA255455)
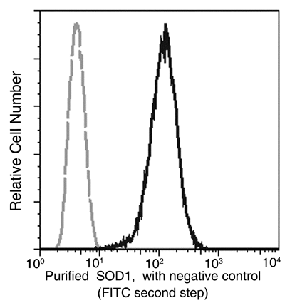
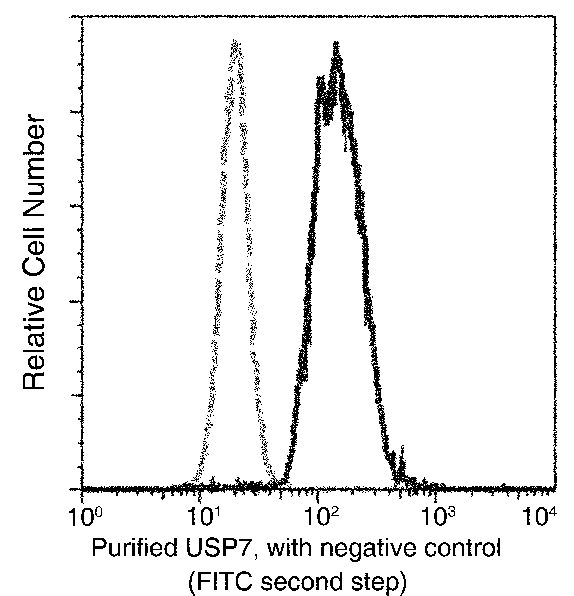 FCM/FACS (Flow Cytometry)
(Flow cytometric analysis of Human USP7 expression on Jurkat cells. The cells were treated according to manufacturer's manual (BD Pharmingen'), stained with purified anti-Human USP7, then a FITC-conjugated second step antibody. The fluorescence histograms were derived from gated events with the forward and side light-scatter characteristics of intact cells.)
FCM/FACS (Flow Cytometry)
(Flow cytometric analysis of Human USP7 expression on Jurkat cells. The cells were treated according to manufacturer's manual (BD Pharmingen'), stained with purified anti-Human USP7, then a FITC-conjugated second step antibody. The fluorescence histograms were derived from gated events with the forward and side light-scatter characteristics of intact cells.)
USP7, Monoclonal Antibody (Cat# AAA255460)
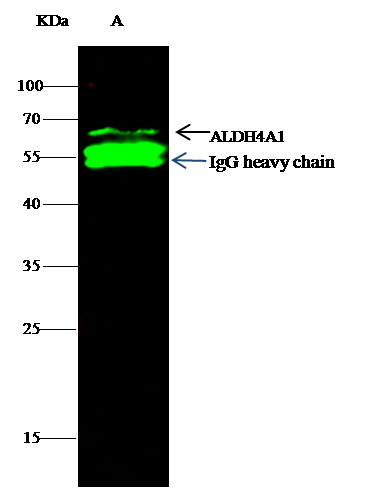
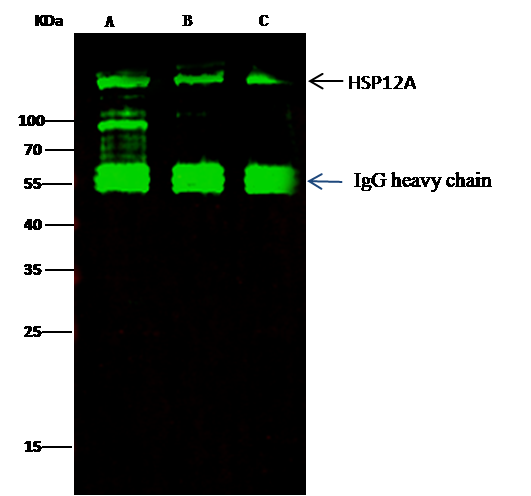
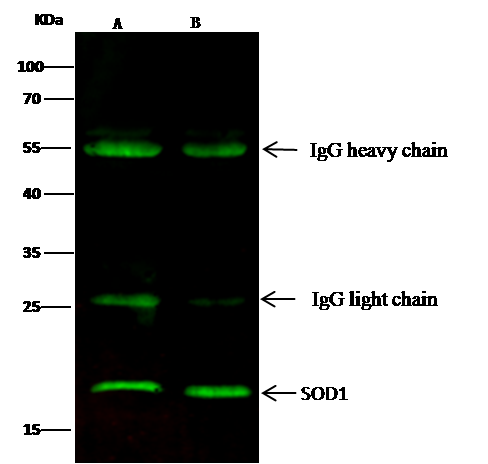 IP (Immunoprecipitation)
(SOD1 was immunoprecipitated using:Lane A:0.5 mg Jurkat Whole Cell LysateLane B:0.5 mg HepG2 Whole Cell Lysate0.5 uL anti-SOD1 mouse monoclonal antibody and 15 ul of 50 % Protein G agarose.Primary antibody:Anti-SOD1 mouse monoclonal antibody,at 1:500 dilutionSecondary antibody:Dylight 800-labeled antibody to Mouse IgG (H+L), at 1:7500 dilutionDeveloped using the odssey technique.Performed under reducing conditions.Predicted band size: 16 kDaObserved band size: 18 kDa)
IP (Immunoprecipitation)
(SOD1 was immunoprecipitated using:Lane A:0.5 mg Jurkat Whole Cell LysateLane B:0.5 mg HepG2 Whole Cell Lysate0.5 uL anti-SOD1 mouse monoclonal antibody and 15 ul of 50 % Protein G agarose.Primary antibody:Anti-SOD1 mouse monoclonal antibody,at 1:500 dilutionSecondary antibody:Dylight 800-labeled antibody to Mouse IgG (H+L), at 1:7500 dilutionDeveloped using the odssey technique.Performed under reducing conditions.Predicted band size: 16 kDaObserved band size: 18 kDa)
SOD1, Monoclonal Antibody (Cat# AAA255463)
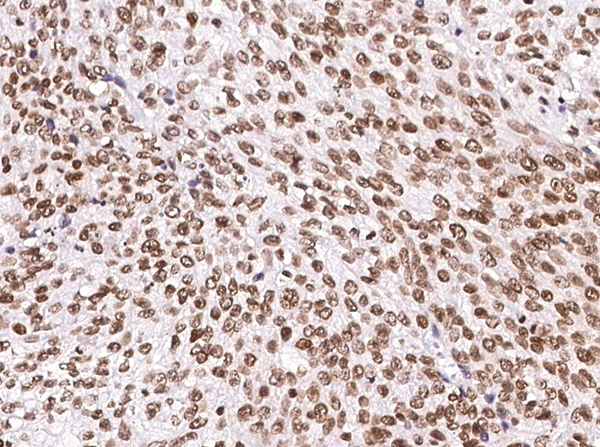
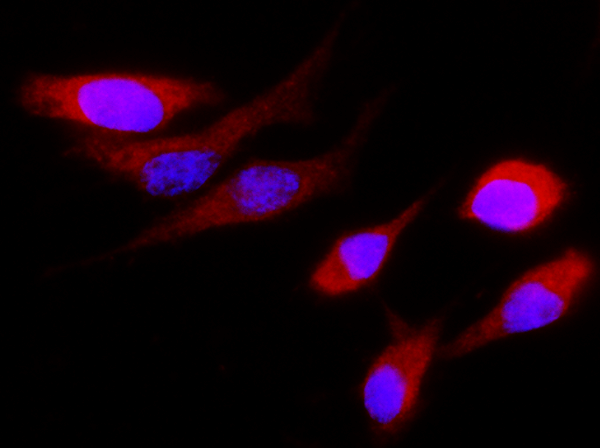
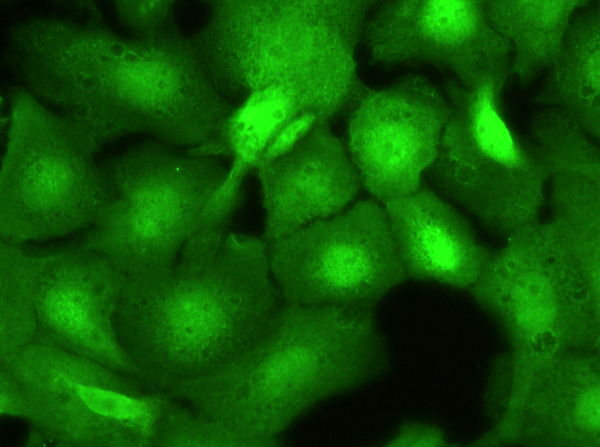
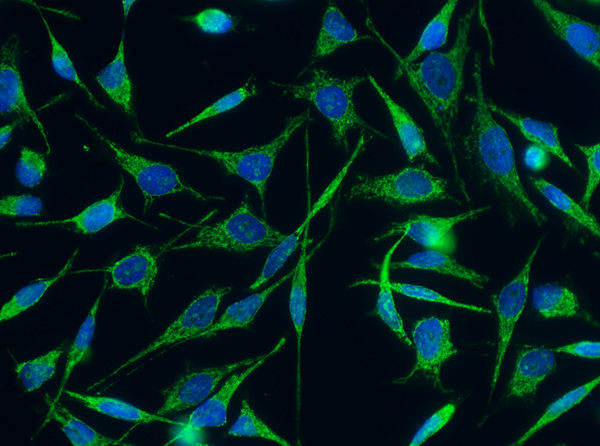
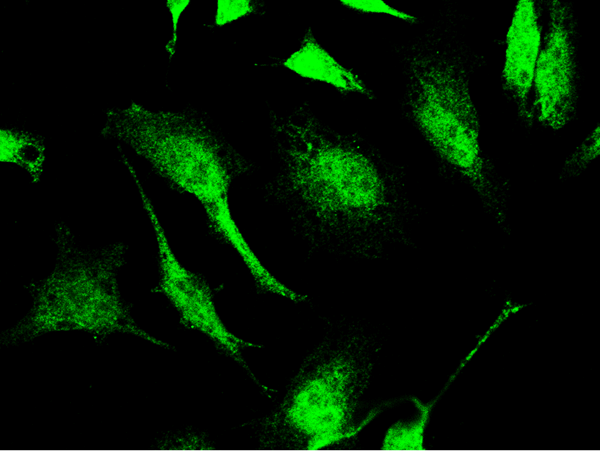 IF (Immunofluorescence)
(Immunofluorescence staining of SIRT1 in Hela cells. Cells were fixed with 4% PFA, permeabilzed with 0.3% Triton X-100 in PBS, blocked with 10% serum, and incubated with mouse anti-Human SIRT1 monoclonal antibody (1:60) at 4 degree C overnight. Then cells were stained with the Alexa Fluor 488-conjugated Goat Anti-mouse IgG secondary antibody(green).)
IF (Immunofluorescence)
(Immunofluorescence staining of SIRT1 in Hela cells. Cells were fixed with 4% PFA, permeabilzed with 0.3% Triton X-100 in PBS, blocked with 10% serum, and incubated with mouse anti-Human SIRT1 monoclonal antibody (1:60) at 4 degree C overnight. Then cells were stained with the Alexa Fluor 488-conjugated Goat Anti-mouse IgG secondary antibody(green).)
SIRT1, Monoclonal Antibody (Cat# AAA255464)
IL-7, Monoclonal Antibody (Cat# AAA255471)
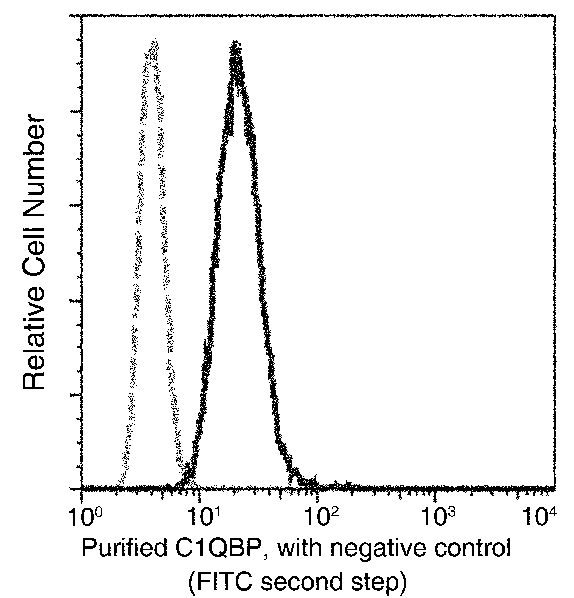 FCM/FACS (Flow Cytometry)
(Flow cytometric analysis of Human C1QBP expression on HeLa cells. The cells were treated according to manufacturer's manual (BD Pharmingen'), stained with purified anti-Human C1QBP, then a FITC-conjugated second step antibody. The fluorescence histograms were derived from gated events with the forward and side light-scatter characteristics of intact cells.)
FCM/FACS (Flow Cytometry)
(Flow cytometric analysis of Human C1QBP expression on HeLa cells. The cells were treated according to manufacturer's manual (BD Pharmingen'), stained with purified anti-Human C1QBP, then a FITC-conjugated second step antibody. The fluorescence histograms were derived from gated events with the forward and side light-scatter characteristics of intact cells.)
C1QBP, Monoclonal Antibody (Cat# AAA255477)
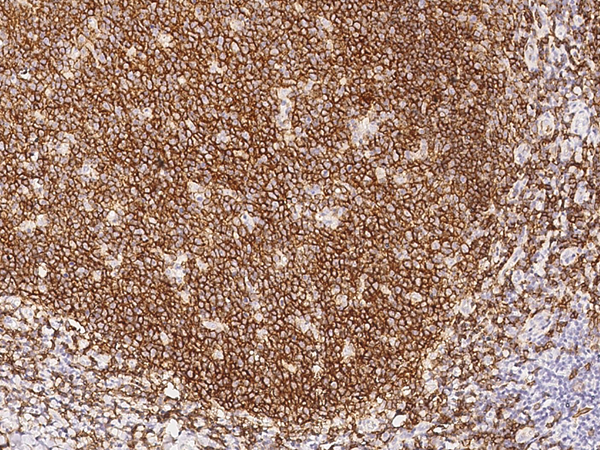
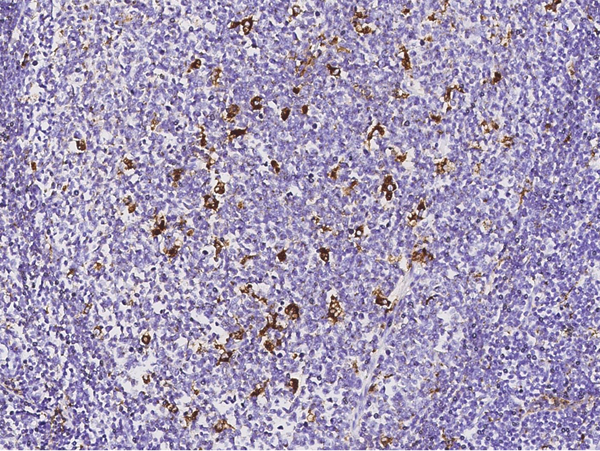
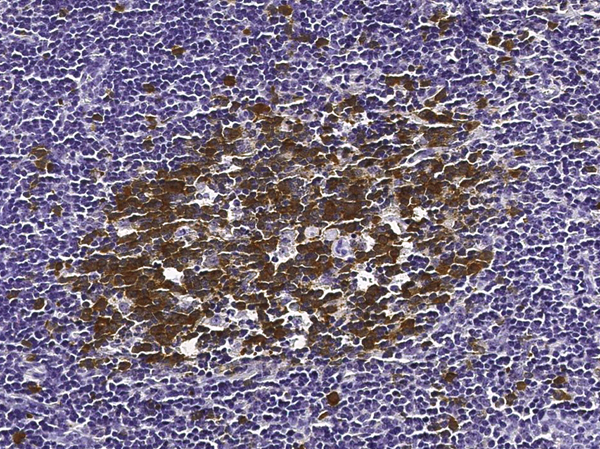
 IHC (Immunohiostchemistry)
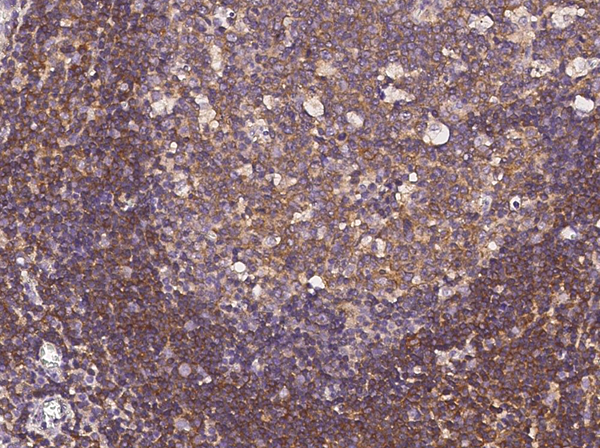
(Immunochemical staining of human CD19 in human spleen with mouse monoclonal antibody(11:200, formalin-fixed paraffin embedded sections).)
IHC (Immunohiostchemistry)
(Immunochemical staining of human CD19 in human spleen with mouse monoclonal antibody(11:200, formalin-fixed paraffin embedded sections).)
CD19, Monoclonal Antibody (Cat# AAA255480)
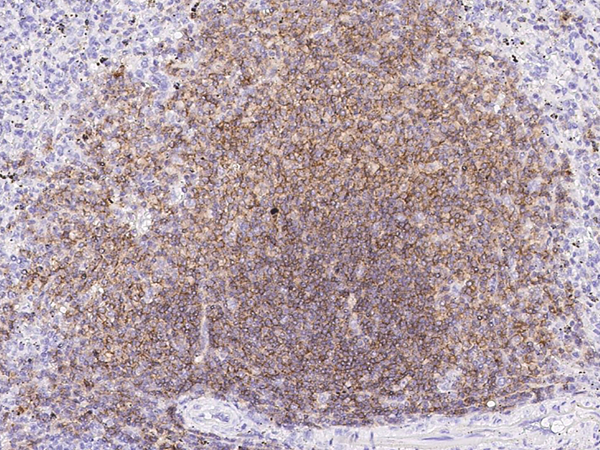
 IHC (Immunohistochemisry)
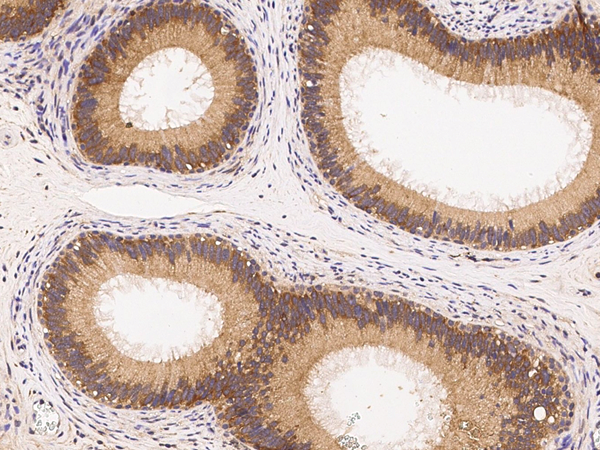
(Immunochemical staining of human ERN1 in human epididymis with mouse monoclonal antibody (1:100, formalin-fixed paraffin embedded sections).)
IHC (Immunohistochemisry)
(Immunochemical staining of human ERN1 in human epididymis with mouse monoclonal antibody (1:100, formalin-fixed paraffin embedded sections).)
IRE1, Monoclonal Antibody (Cat# AAA255483)
 FCM/FACS (Flow Cytometry)
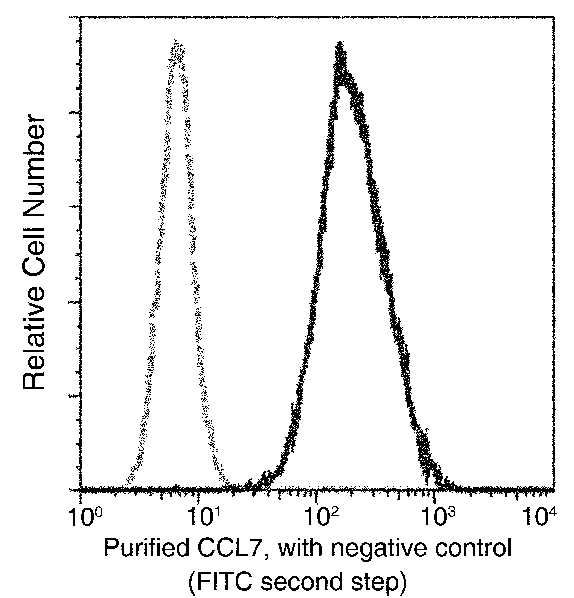
(Flow cytometric analysis of Human CCL7 expression on THP-1 cells. The cells were treated according to manufacturer's manual (BD Pharmingen'), stained with purified anti-Human CCL7, then a FITC-conjugated second step antibody. The fluorescence histograms were derived from gated events with the forward and side light-scatter characteristics of intact cells.)
FCM/FACS (Flow Cytometry)
(Flow cytometric analysis of Human CCL7 expression on THP-1 cells. The cells were treated according to manufacturer's manual (BD Pharmingen'), stained with purified anti-Human CCL7, then a FITC-conjugated second step antibody. The fluorescence histograms were derived from gated events with the forward and side light-scatter characteristics of intact cells.)
MCP3, Monoclonal Antibody (Cat# AAA255484)
 IF (Immunofluorescence)
(Immunofluorescence staining of RHOA in Hela cells. Cells were fixed with 4% PFA,blocked with 10% serum, and incubated with rabbit anti-human RHOA monoclonal antibody (dilution ratio 1:60) at 4 degree C overnight. Then cells were stained with the Alexa Fluor488-conjugated Goat Anti-rabbit IgG secondary antibody (green) and counterstained with DAPI (blue).Positive staining was localized to Cytoplasm.)
IF (Immunofluorescence)
(Immunofluorescence staining of RHOA in Hela cells. Cells were fixed with 4% PFA,blocked with 10% serum, and incubated with rabbit anti-human RHOA monoclonal antibody (dilution ratio 1:60) at 4 degree C overnight. Then cells were stained with the Alexa Fluor488-conjugated Goat Anti-rabbit IgG secondary antibody (green) and counterstained with DAPI (blue).Positive staining was localized to Cytoplasm.)
RhoA, Monoclonal Antibody (Cat# AAA255574)
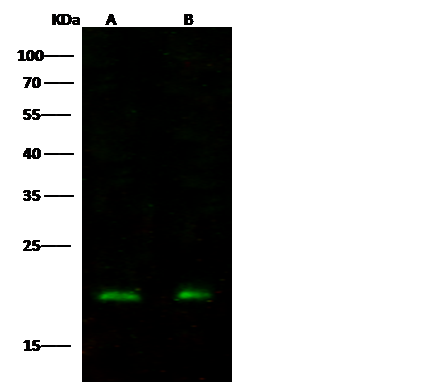
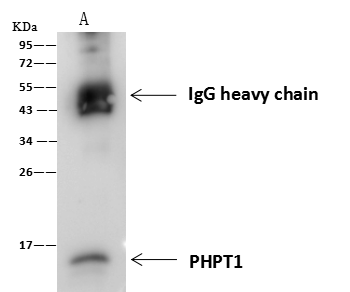 IP (Immunoprecipitation)
(PHPT1 was immunoprecipitated using:Lane A:0.5 mg HepG2 Whole Cell Lysate4 uL anti-PHPT1 rabbit monoclonal antibody and 60 ug of Immunomagnetic beads Protein A/G.Primary antibody:Anti-PHPT1 rabbit monoclonal antibody,at 1:100 dilutionSecondary antibody:Goat Anti-Rabbit IgG (H+L)/HRP at 1/10000 dilutionDeveloped using the ECL technique.Performed under reducing conditions.Predicted band size: 14 kDaObserved band size :14 kDa)
IP (Immunoprecipitation)
(PHPT1 was immunoprecipitated using:Lane A:0.5 mg HepG2 Whole Cell Lysate4 uL anti-PHPT1 rabbit monoclonal antibody and 60 ug of Immunomagnetic beads Protein A/G.Primary antibody:Anti-PHPT1 rabbit monoclonal antibody,at 1:100 dilutionSecondary antibody:Goat Anti-Rabbit IgG (H+L)/HRP at 1/10000 dilutionDeveloped using the ECL technique.Performed under reducing conditions.Predicted band size: 14 kDaObserved band size :14 kDa)
PHPT1, Monoclonal Antibody (Cat# AAA255580)
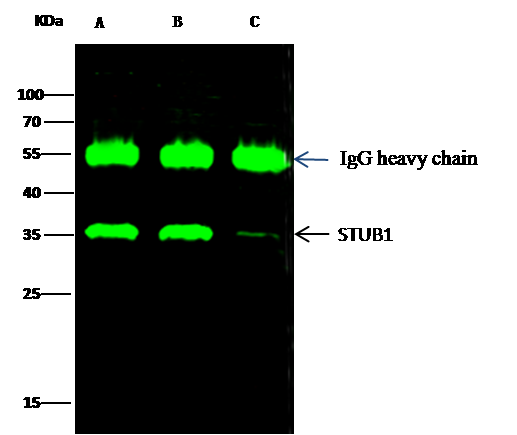
 FCM/FACS (Flow Cytometry)
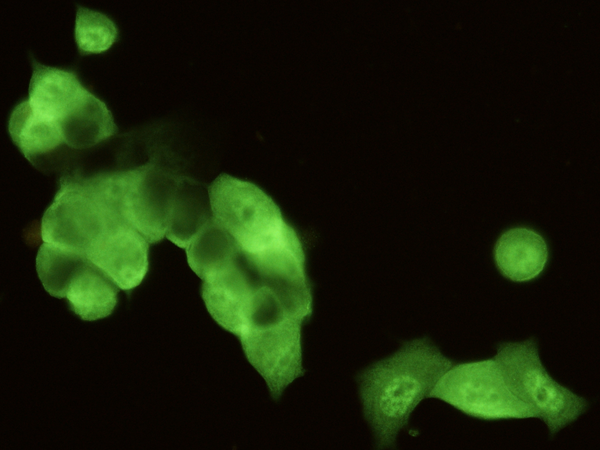
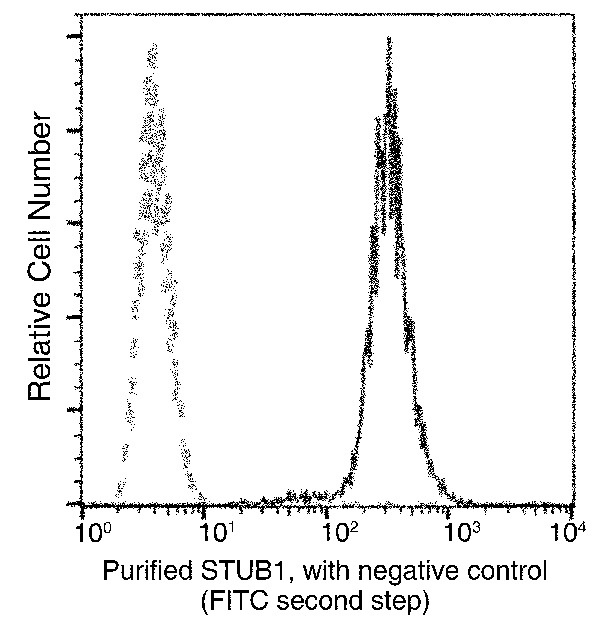
(Flow cytometric analysis of Human STUB1 expression on Hela cells. The cells were treated according to manufacturer's manual (BD Pharmingen'), stained with purified anti-Human STUB1, then a FITC-conjugated second step antibody. The fluorescence histograms were derived from gated events with the forward and side light-scatter characteristics of intact cells.)
FCM/FACS (Flow Cytometry)
(Flow cytometric analysis of Human STUB1 expression on Hela cells. The cells were treated according to manufacturer's manual (BD Pharmingen'), stained with purified anti-Human STUB1, then a FITC-conjugated second step antibody. The fluorescence histograms were derived from gated events with the forward and side light-scatter characteristics of intact cells.)
STUB1, Monoclonal Antibody (Cat# AAA255588)
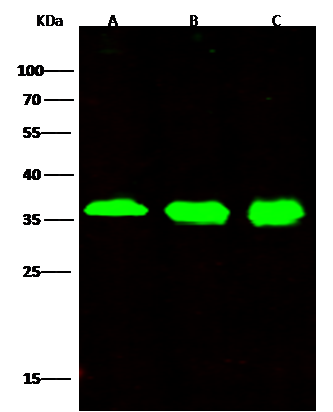
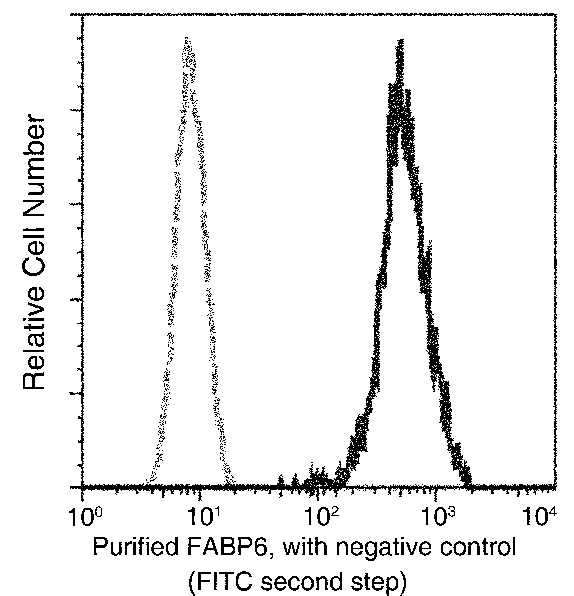 FCM/FACS (Flow Cytometry)
(Flow cytometric analysis of Human FABP6 expression on MCF-7 cells. The cells were treated according to manufacturer's manual (BD Pharmingen'), stained with purified anti-Human FABP6, then a FITC-conjugated second step antibody. The fluorescence histograms were derived from gated events with the forward and side light-scatter characteristics of intact cells.)
FCM/FACS (Flow Cytometry)
(Flow cytometric analysis of Human FABP6 expression on MCF-7 cells. The cells were treated according to manufacturer's manual (BD Pharmingen'), stained with purified anti-Human FABP6, then a FITC-conjugated second step antibody. The fluorescence histograms were derived from gated events with the forward and side light-scatter characteristics of intact cells.)
FABP6, Monoclonal Antibody (Cat# AAA255593)
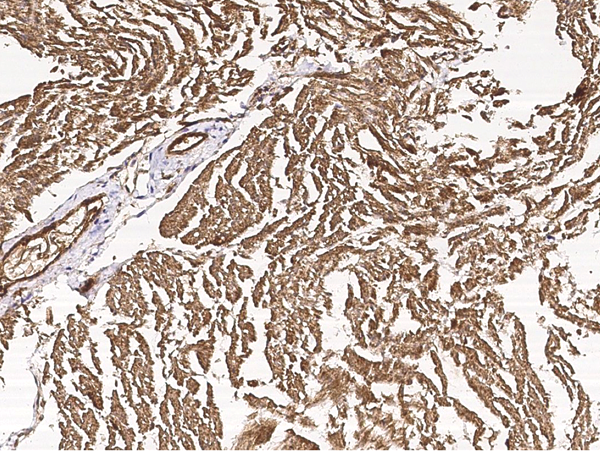
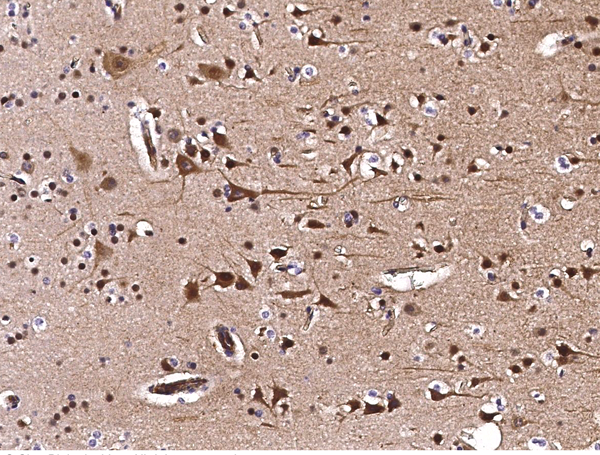 IHC (Immunohiostchemistry)
(Immunochemical staining of human CIB2 in human brain with rabbit monoclonal antibody (1:2000, formalin-fixed paraffin embedded sections).)
IHC (Immunohiostchemistry)
(Immunochemical staining of human CIB2 in human brain with rabbit monoclonal antibody (1:2000, formalin-fixed paraffin embedded sections).)
CIB2, Monoclonal Antibody (Cat# AAA255596)
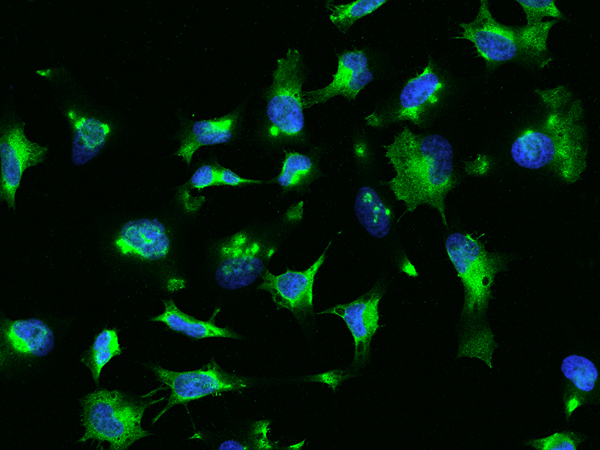
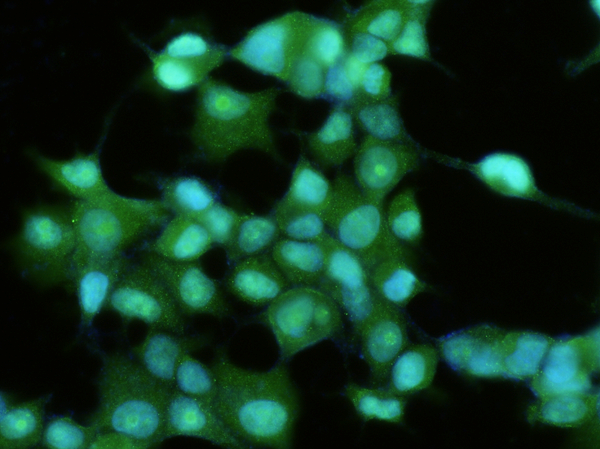
 IF (Immunofluorescence)
(Immunofluorescence staining of IFI30 in Hela cells. Cells were fixed with 4% PFA, permeabilzed with 0.1% Triton X-100 in PBS,blocked with 10% serum, and incubated with rabbit anti- IFI30 monoclonal antibody (dilution ratio 1:30) at 4 degree C overnight. Then cells were stained with the Alexa Fluor488-conjugated Goat Anti-rabbit IgG secondary antibody (green). Positive staining was localized to Cytoplasm.)
IF (Immunofluorescence)
(Immunofluorescence staining of IFI30 in Hela cells. Cells were fixed with 4% PFA, permeabilzed with 0.1% Triton X-100 in PBS,blocked with 10% serum, and incubated with rabbit anti- IFI30 monoclonal antibody (dilution ratio 1:30) at 4 degree C overnight. Then cells were stained with the Alexa Fluor488-conjugated Goat Anti-rabbit IgG secondary antibody (green). Positive staining was localized to Cytoplasm.)
IFI30, Monoclonal Antibody (Cat# AAA255598)
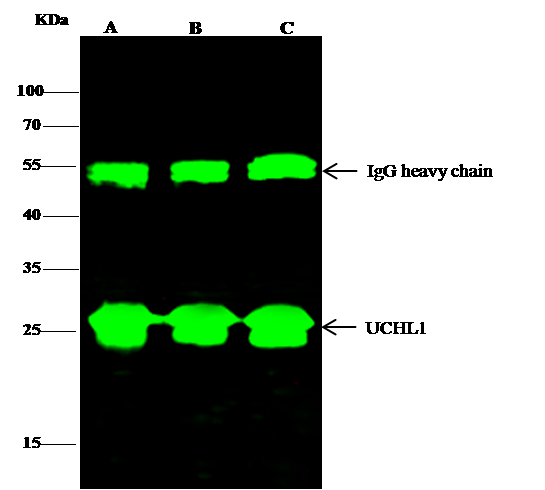
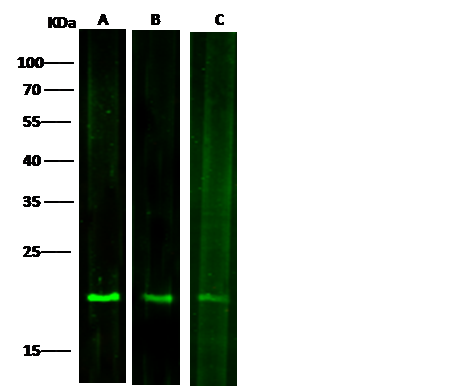
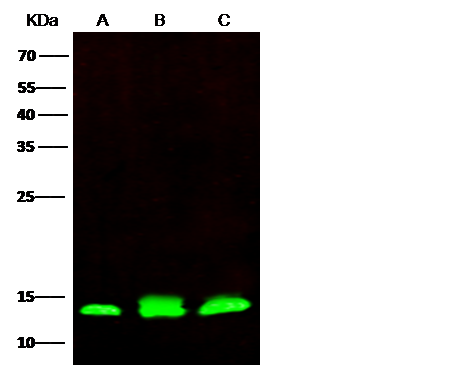
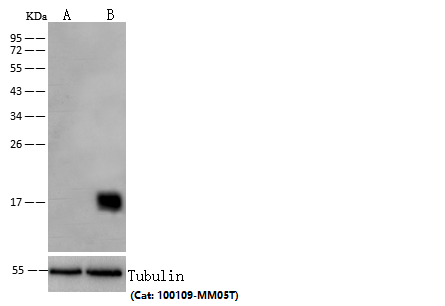
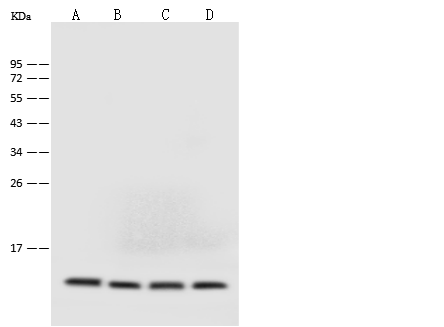
 WB (Western Blot)
(Anti-ISG15 rabbit monoclonal antibody at 1:5000 dilutionLane A: Hela Whole Cell LysateLane B: 293 Whole Cell LysateLane C: Daudi Whole Cell LysateLysates/proteins at 30 ug per lane.SecondaryGoat Anti-Rabbit IgG H&L (Dylight800) at 1/10000 dilution.Developed using the Odyssey technique.Performed under reducing conditions.Predicted band size:18 kDaObserved band size:15 kDa)
WB (Western Blot)
(Anti-ISG15 rabbit monoclonal antibody at 1:5000 dilutionLane A: Hela Whole Cell LysateLane B: 293 Whole Cell LysateLane C: Daudi Whole Cell LysateLysates/proteins at 30 ug per lane.SecondaryGoat Anti-Rabbit IgG H&L (Dylight800) at 1/10000 dilution.Developed using the Odyssey technique.Performed under reducing conditions.Predicted band size:18 kDaObserved band size:15 kDa)
ISG15, Monoclonal Antibody (Cat# AAA255607)
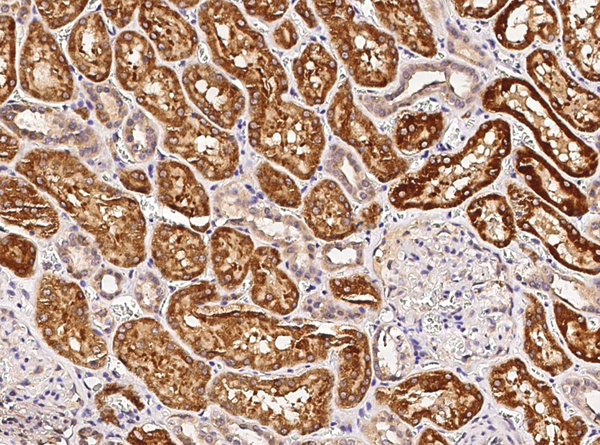
 IHC (Immunohiostchemistry)
(Immunochemical staining of human CLEC3B in human kidney with rabbit monoclonal antibody (1:200, formalin-fixed paraffin embedded sections).)
IHC (Immunohiostchemistry)
(Immunochemical staining of human CLEC3B in human kidney with rabbit monoclonal antibody (1:200, formalin-fixed paraffin embedded sections).)
Tetranectin, Monoclonal Antibody (Cat# AAA255608)
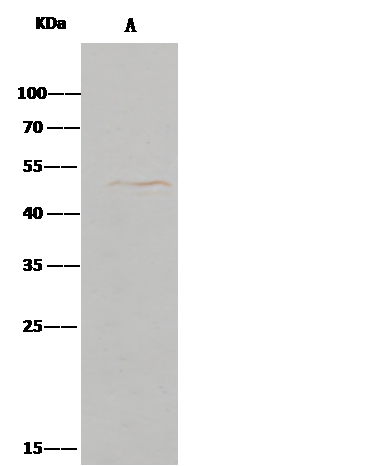
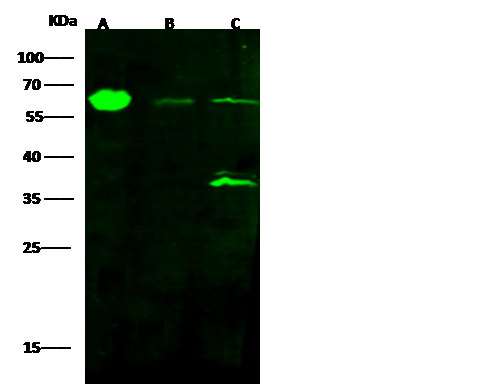 WB (Western Blot)
(Anti-ALDH4A1 rabbit monoclonal antibody at 1:500 dilutionLane A: HepG2 Whole Cell LysateLane B: K562 Whole Cell LysateLane C: A549 Whole Cell LysateLysates/proteins at 30 ug per lane.SecondaryGoat Anti-Rabbit IgG H&L (Dylight800) at 1/10000 dilution.Developed using the Odyssey technique.Performed under reducing conditions.Predicted band size:62 kDaObserved band size:62 kDa(We are unsure as to the identity of these extra bands.))
WB (Western Blot)
(Anti-ALDH4A1 rabbit monoclonal antibody at 1:500 dilutionLane A: HepG2 Whole Cell LysateLane B: K562 Whole Cell LysateLane C: A549 Whole Cell LysateLysates/proteins at 30 ug per lane.SecondaryGoat Anti-Rabbit IgG H&L (Dylight800) at 1/10000 dilution.Developed using the Odyssey technique.Performed under reducing conditions.Predicted band size:62 kDaObserved band size:62 kDa(We are unsure as to the identity of these extra bands.))
ALDH4A1, Monoclonal Antibody (Cat# AAA255609)
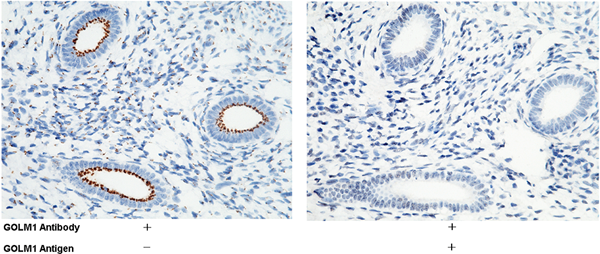
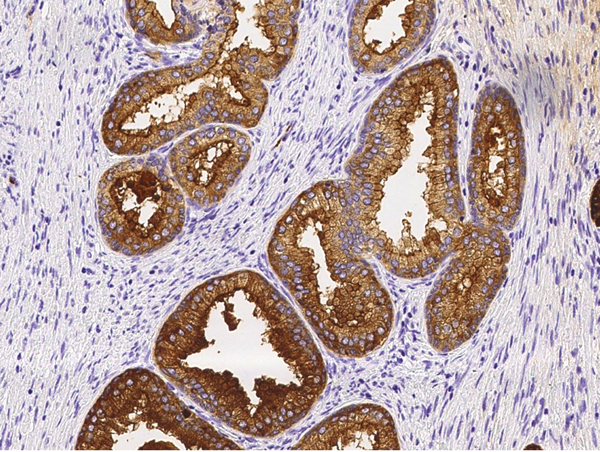
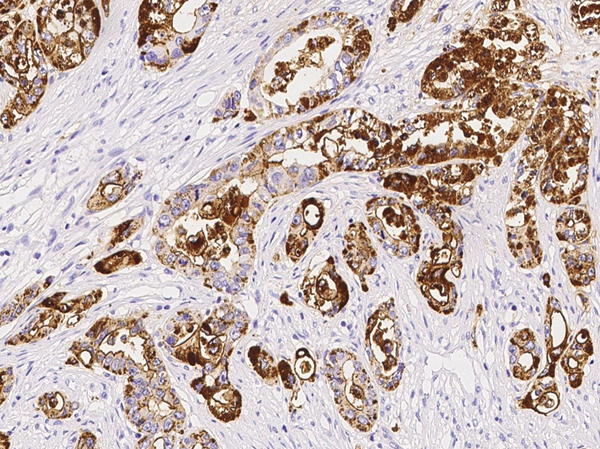
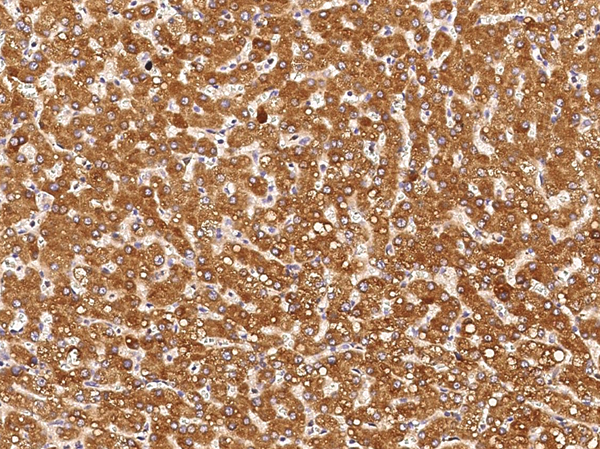
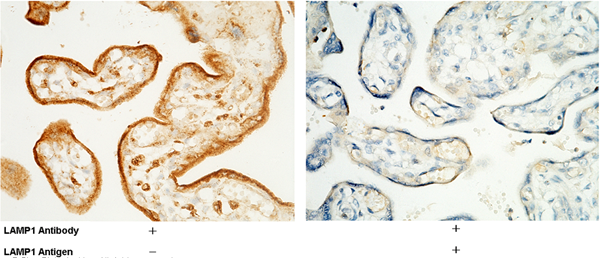
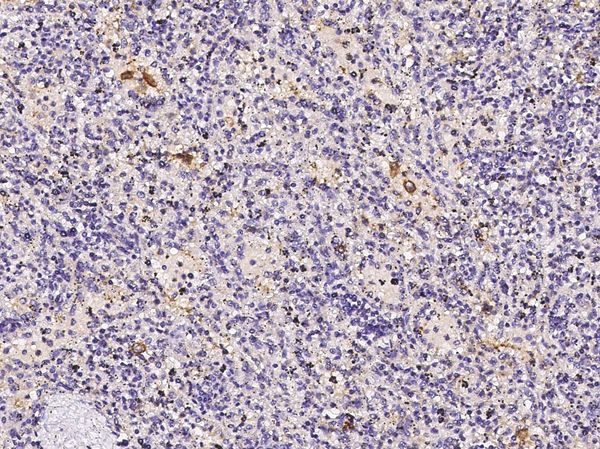
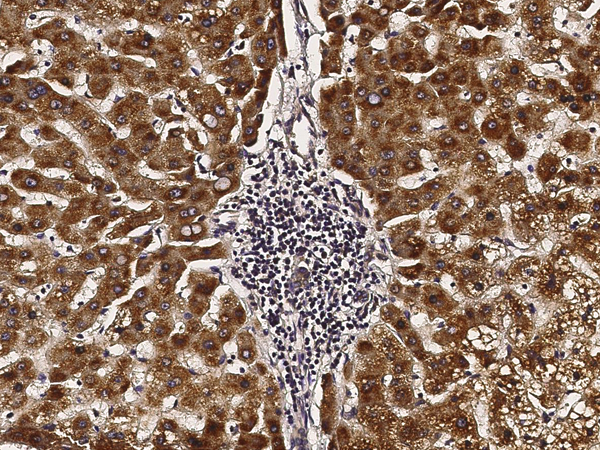
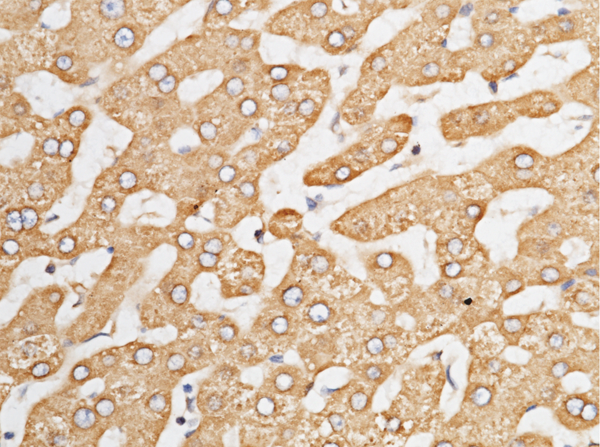
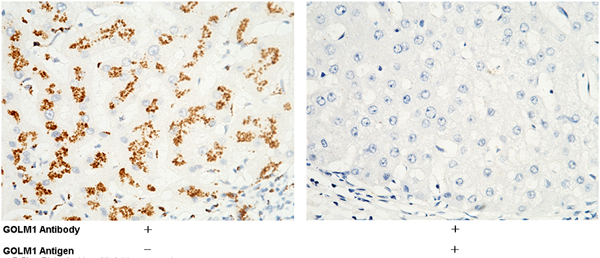 IHC (Immunohiostchemistry)
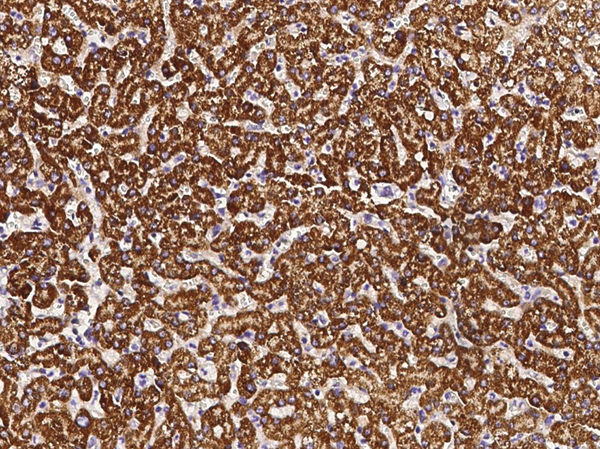
(Immunochemical staining of human GOLM1 in human liver with rabbit monoclonal antibody (1:200, formalin-fixed paraffin embedded sections). Positive staining was localized to cytoplasm of hepatocyte and interlobular bile duct. The left panel: tissue incubated with primary antibody; The right panel: tissue incubated with the mixture of primary antibody and antigen (recombinant protein).)
IHC (Immunohiostchemistry)
(Immunochemical staining of human GOLM1 in human liver with rabbit monoclonal antibody (1:200, formalin-fixed paraffin embedded sections). Positive staining was localized to cytoplasm of hepatocyte and interlobular bile duct. The left panel: tissue incubated with primary antibody; The right panel: tissue incubated with the mixture of primary antibody and antigen (recombinant protein).)
GOLPH2/GOLM1, Monoclonal Antibody (Cat# AAA255625)
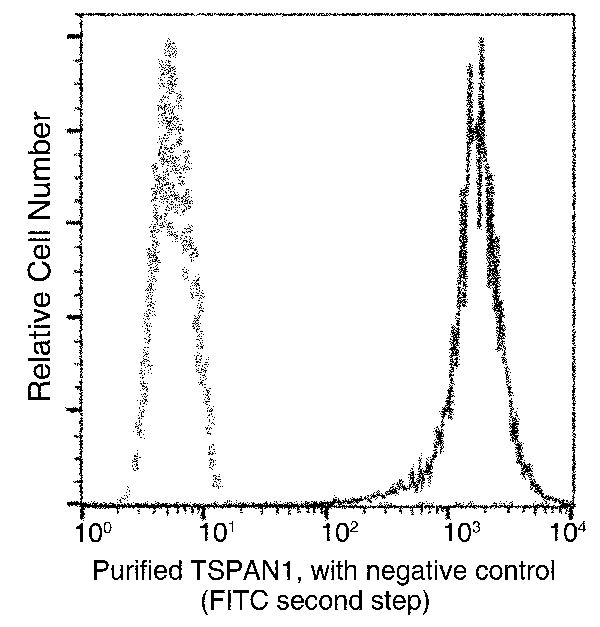 FCM/FACS (Flow Cytometry)
(Flow cytometric analysis of Human TSPAN1 expression on SW480 cells. The cells were treated according to manufacturer's manual (BD Pharmingen'), stained with purified anti-Human TSPAN1, then a FITC-conjugated second step antibody. The fluorescence histograms were derived from gated events with the forward and side light-scatter characteristics of intact cells.)
FCM/FACS (Flow Cytometry)
(Flow cytometric analysis of Human TSPAN1 expression on SW480 cells. The cells were treated according to manufacturer's manual (BD Pharmingen'), stained with purified anti-Human TSPAN1, then a FITC-conjugated second step antibody. The fluorescence histograms were derived from gated events with the forward and side light-scatter characteristics of intact cells.)
TSPAN1, Monoclonal Antibody (Cat# AAA255628)
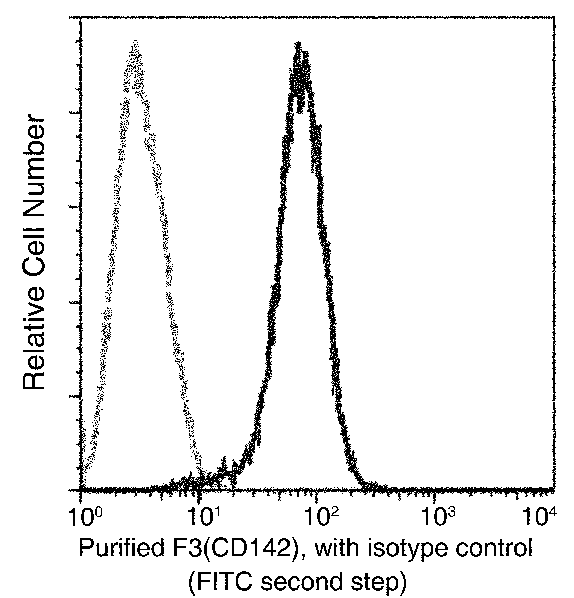 FCM/FACS (Flow Cytometry)
(Flow cytometric analysis of Human F3(CD142) expression on A431 cells. Cells were stained with purified anti-Human F3(CD142), then a FITC-conjugated second step antibody. The fluorescence histograms were derived from gated events with the forward and side light-scatter characteristics of intact cells.)
FCM/FACS (Flow Cytometry)
(Flow cytometric analysis of Human F3(CD142) expression on A431 cells. Cells were stained with purified anti-Human F3(CD142), then a FITC-conjugated second step antibody. The fluorescence histograms were derived from gated events with the forward and side light-scatter characteristics of intact cells.)
Tissue Factor, Monoclonal Antibody (Cat# AAA255636)
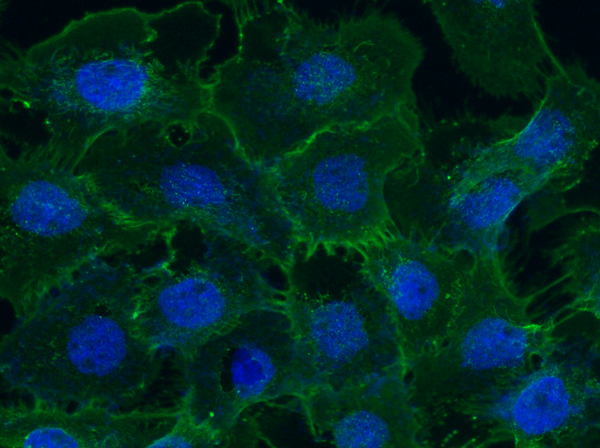
 IF (Immunofluorescence)
(Immunofluorescence staining of RRM2B in Hela cells. Cells were fixed with 4% PFA, permeabilzed with 0.1% Triton X-100 in PBS,blocked with 10% serum, and incubated with rabbit anti-Y RRM2B monoclonal antibody (dilution ratio 1:60) at 4 degree C overnight. Then cells were stained with the Alexa Fluor488-conjugated Goat Anti-rabbit IgG secondary antibody (green). Positive staining was localized to Cytoplasm and Nucleus.)
IF (Immunofluorescence)
(Immunofluorescence staining of RRM2B in Hela cells. Cells were fixed with 4% PFA, permeabilzed with 0.1% Triton X-100 in PBS,blocked with 10% serum, and incubated with rabbit anti-Y RRM2B monoclonal antibody (dilution ratio 1:60) at 4 degree C overnight. Then cells were stained with the Alexa Fluor488-conjugated Goat Anti-rabbit IgG secondary antibody (green). Positive staining was localized to Cytoplasm and Nucleus.)
p53R2, Monoclonal Antibody (Cat# AAA255642)
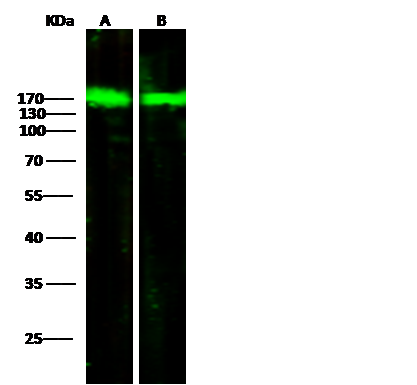
 WB (Western Blot)
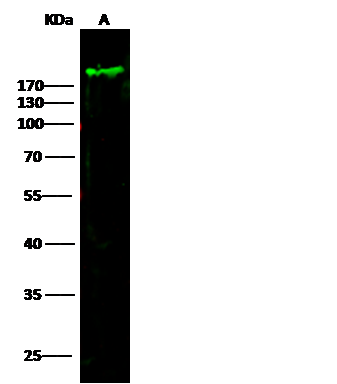
(Anti-MKI67 mouse monoclonal antibody at 1:500 dilutionLane A: K562 Whole Cell LysateLysates/proteins at 30 ug per lane.SecondaryGoat Anti-Mouse IgG H&L (Dylight800) at 1/15000 dilution.Developed using the Odyssey technique.Performed under reducing conditions.Predicted band size:358 kDaObserved band size:358 kDa)
WB (Western Blot)
(Anti-MKI67 mouse monoclonal antibody at 1:500 dilutionLane A: K562 Whole Cell LysateLysates/proteins at 30 ug per lane.SecondaryGoat Anti-Mouse IgG H&L (Dylight800) at 1/15000 dilution.Developed using the Odyssey technique.Performed under reducing conditions.Predicted band size:358 kDaObserved band size:358 kDa)
Ki67/MKI67, Monoclonal Antibody (Cat# AAA255651)
 IP (Immunoprecipitation)
(ENTPD5 was immunoprecipitated using:Lane A:0.5 mg HepG2 Whole Cell Lysate0.5 uL anti-ENTPD5 rabbit monoclonal antibody and 15 ul of 50 % Protein G agarose.Primary antibody:Anti-ENTPD5 rabbit monoclonal antibody,at 1:500 dilutionSecondary antibody:Clean-Blot IP Detection Reagent (HRP) at 1:1000 dilutionDeveloped using the DAB staining technique.Performed under reducing conditions.Predicted band size: 47 kDaObserved band size: 47 kDa)
IP (Immunoprecipitation)
(ENTPD5 was immunoprecipitated using:Lane A:0.5 mg HepG2 Whole Cell Lysate0.5 uL anti-ENTPD5 rabbit monoclonal antibody and 15 ul of 50 % Protein G agarose.Primary antibody:Anti-ENTPD5 rabbit monoclonal antibody,at 1:500 dilutionSecondary antibody:Clean-Blot IP Detection Reagent (HRP) at 1:1000 dilutionDeveloped using the DAB staining technique.Performed under reducing conditions.Predicted band size: 47 kDaObserved band size: 47 kDa)
ENTPD5, Monoclonal Antibody (Cat# AAA255338)
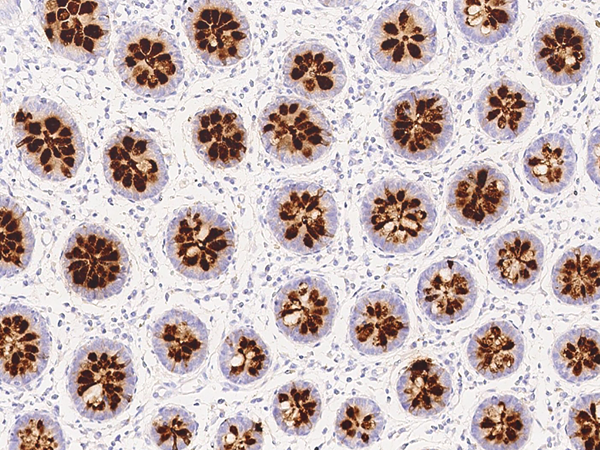
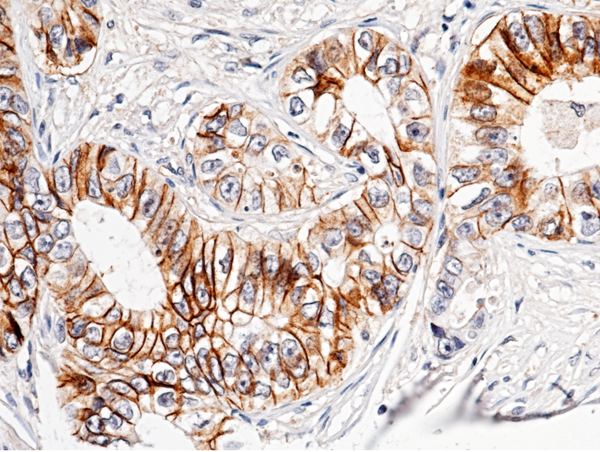
 IHC (Immunohiostchemistry)
(Immunochemical staining of human REG4 in human small intestine with rabbit monoclonal antibody at 1:200 dilution, formalin-fixed paraffin embedded sections.)
IHC (Immunohiostchemistry)
(Immunochemical staining of human REG4 in human small intestine with rabbit monoclonal antibody at 1:200 dilution, formalin-fixed paraffin embedded sections.)
REG4, Monoclonal Antibody (Cat# AAA255340)
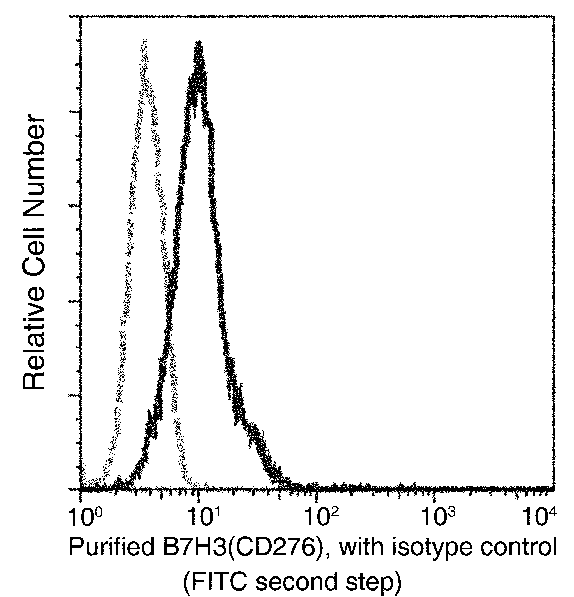 FCM/FACS (Flow Cytometry)
(Flow cytometric analysis of Human B7H3(CD276) expression on PC-3 cells. Cells were stained with purified anti-Human B7H3(CD276), then a FITC-conjugated second step antibody. The histogram were derived from gated events with the forward and side light-scatter characteristics of intact cells.)
FCM/FACS (Flow Cytometry)
(Flow cytometric analysis of Human B7H3(CD276) expression on PC-3 cells. Cells were stained with purified anti-Human B7H3(CD276), then a FITC-conjugated second step antibody. The histogram were derived from gated events with the forward and side light-scatter characteristics of intact cells.)
B7-H3, Monoclonal Antibody (Cat# AAA255341)
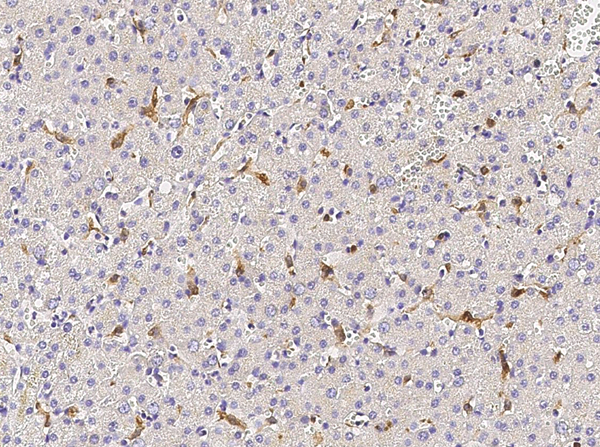 IHC (Immunohiostchemistry)
(Immunochemical staining of human CD68 in human liver with mouse monoclonal antibody (1:500, formalin-fixed paraffin embedded sections).)
IHC (Immunohiostchemistry)
(Immunochemical staining of human CD68 in human liver with mouse monoclonal antibody (1:500, formalin-fixed paraffin embedded sections).)
CD68, Monoclonal Antibody (Cat# AAA255344)
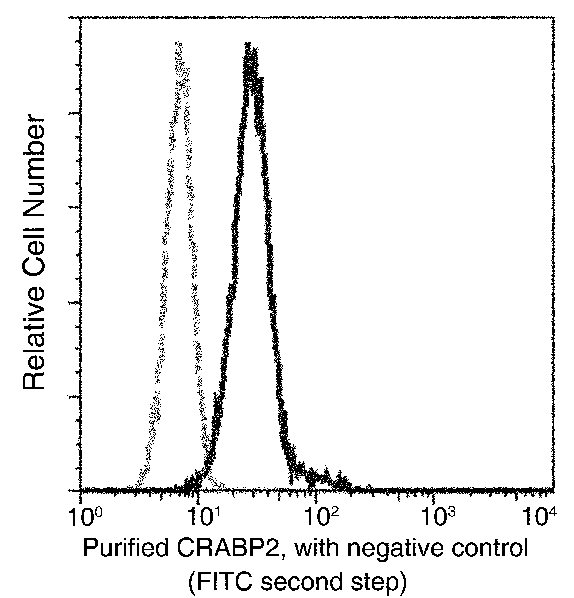 FCM/FACS (Flow Cytometry)
(Flow cytometric analysis of Human CRABP2 expression on MCF-7 cells. The cells were treated according to manufacturer's manual (BD Pharmingen'), stained with purified anti-Human CRABP2, then a FITC-conjugated second step antibody. The fluorescence histograms were derived from gated events with the forward and side light-scatter characteristics of intact cells.)
FCM/FACS (Flow Cytometry)
(Flow cytometric analysis of Human CRABP2 expression on MCF-7 cells. The cells were treated according to manufacturer's manual (BD Pharmingen'), stained with purified anti-Human CRABP2, then a FITC-conjugated second step antibody. The fluorescence histograms were derived from gated events with the forward and side light-scatter characteristics of intact cells.)
CRABP2, Monoclonal Antibody (Cat# AAA255352)
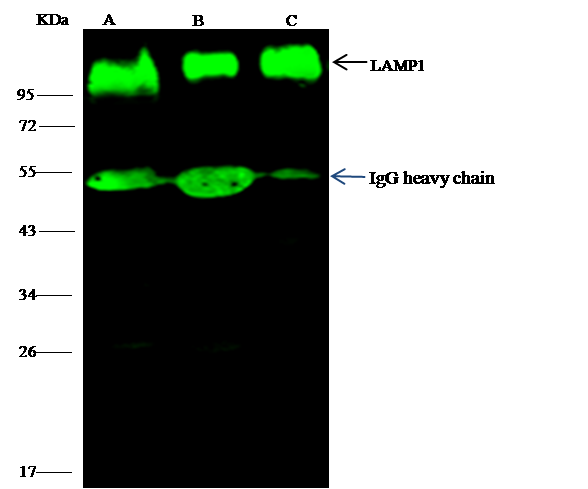 IP (Immunoprecipitation)
(LAMP1 was immunoprecipitated using:Lane A:0.5 mg Hela Whole Cell LysateLane B:0.5 mg Jurkat Whole Cell LysateLane C:0.5 mg Daudi Whole Cell Lysate4 uL anti-LAMP1 mouse monoclonal antibody and 15 ul of 50 % Protein G agarose.Primary antibody:Anti-LAMP1 mouse monoclonal antibody,at 1:100 dilutionSecondary antibody:Dylight 800-labeled antibody to Mouse IgG (H+L), at 1:7500 dilutionDeveloped using the odssey technique.Performed under reducing conditions.Predicted band size: 45 kDaObserved band size: 113 kDa)
IP (Immunoprecipitation)
(LAMP1 was immunoprecipitated using:Lane A:0.5 mg Hela Whole Cell LysateLane B:0.5 mg Jurkat Whole Cell LysateLane C:0.5 mg Daudi Whole Cell Lysate4 uL anti-LAMP1 mouse monoclonal antibody and 15 ul of 50 % Protein G agarose.Primary antibody:Anti-LAMP1 mouse monoclonal antibody,at 1:100 dilutionSecondary antibody:Dylight 800-labeled antibody to Mouse IgG (H+L), at 1:7500 dilutionDeveloped using the odssey technique.Performed under reducing conditions.Predicted band size: 45 kDaObserved band size: 113 kDa)
LAMP1, Monoclonal Antibody (Cat# AAA255357)
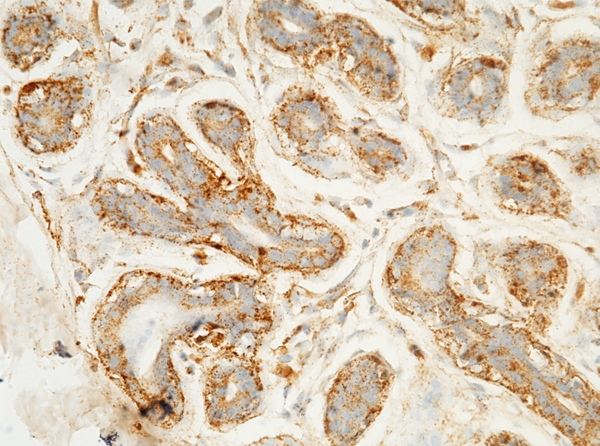
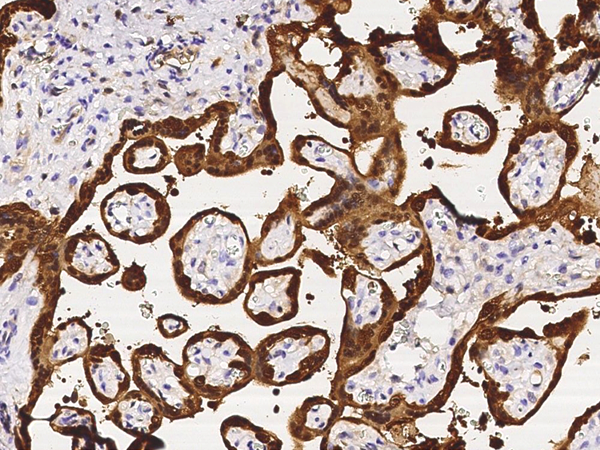
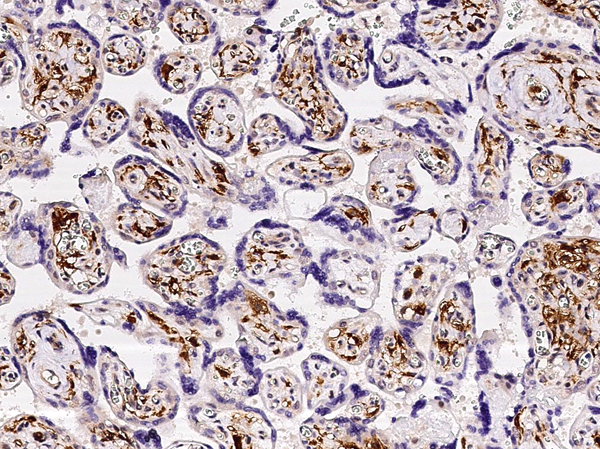 IHC (Immunohiostchemistry)
(Immunochemical staining of human FOLR2 in human placenta with rabbit monoclonal antibody at 1:5000 dilution,formalin-fixed paraffin embedded sections.)
IHC (Immunohiostchemistry)
(Immunochemical staining of human FOLR2 in human placenta with rabbit monoclonal antibody at 1:5000 dilution,formalin-fixed paraffin embedded sections.)
FOLR2, Monoclonal Antibody (Cat# AAA255361)
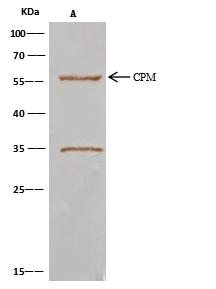 IP (Immunoprecipitation)
(CPM was immunoprecipitated using:Lane A:0.5 mg HepG2 Whole Cell Lysate2 uL anti-CPM rabbit monoclonal antibody and 15 ul of 50 % Protein G agarose.Primary antibody:Anti-CPM rabbit monoclonal antibody,at 1:100 dilutionSecondary antibody:Clean-Blot IP Detection Reagent (HRP) at 1:1000 dilutionDeveloped using the DAB staining technique.Performed under reducing conditions.Predicted band size: 55 kDaObserved band size: 55 kDa)
IP (Immunoprecipitation)
(CPM was immunoprecipitated using:Lane A:0.5 mg HepG2 Whole Cell Lysate2 uL anti-CPM rabbit monoclonal antibody and 15 ul of 50 % Protein G agarose.Primary antibody:Anti-CPM rabbit monoclonal antibody,at 1:100 dilutionSecondary antibody:Clean-Blot IP Detection Reagent (HRP) at 1:1000 dilutionDeveloped using the DAB staining technique.Performed under reducing conditions.Predicted band size: 55 kDaObserved band size: 55 kDa)
Carboxypeptidase M, Monoclonal Antibody (Cat# AAA255365)
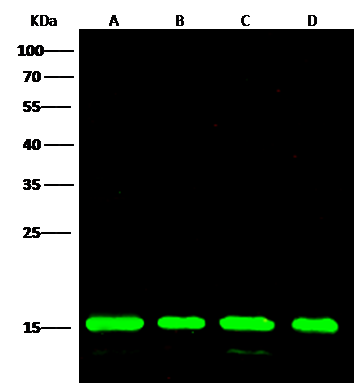
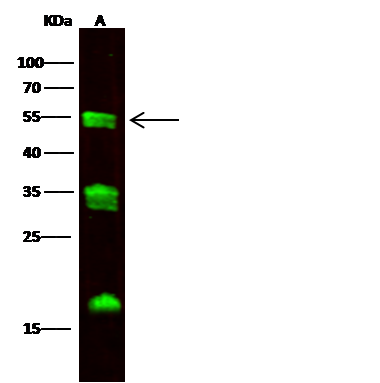
 WB (Western Blot)
(Anti-PRDX5 rabbit monoclonal antibody at 1:1000 dilutionLane A: PRDX5 konckout Hela Whole Cell LysateLane B: Hela Whole Cell LysateLysates/proteins at 30 ug per lane.SecondaryGoat Anti-Rabbit IgG (H+L)/HRP at 1/10000 dilution.Developed using the ECL technique.Performed under reducing conditions.Predicted band size:22 kDaObserved band size:15 kDa)
WB (Western Blot)
(Anti-PRDX5 rabbit monoclonal antibody at 1:1000 dilutionLane A: PRDX5 konckout Hela Whole Cell LysateLane B: Hela Whole Cell LysateLysates/proteins at 30 ug per lane.SecondaryGoat Anti-Rabbit IgG (H+L)/HRP at 1/10000 dilution.Developed using the ECL technique.Performed under reducing conditions.Predicted band size:22 kDaObserved band size:15 kDa)
Peroxiredoxin 5, Monoclonal Antibody (Cat# AAA255376)
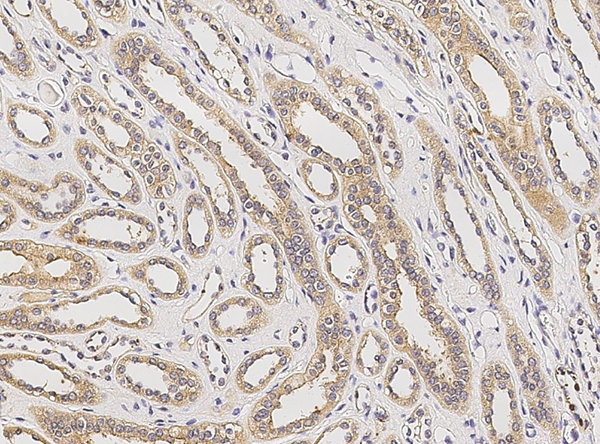
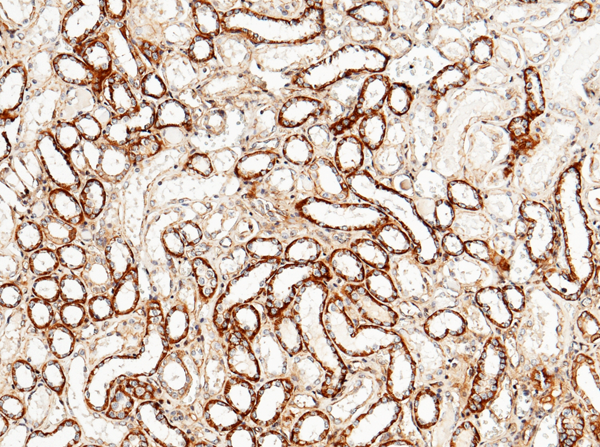
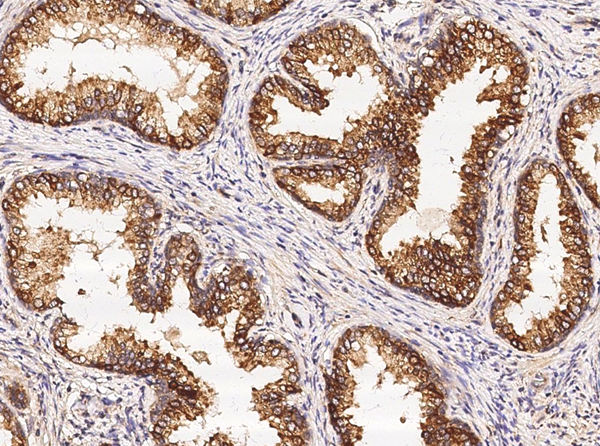
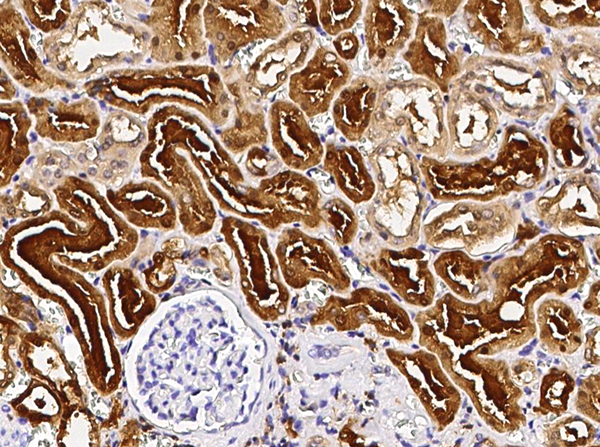
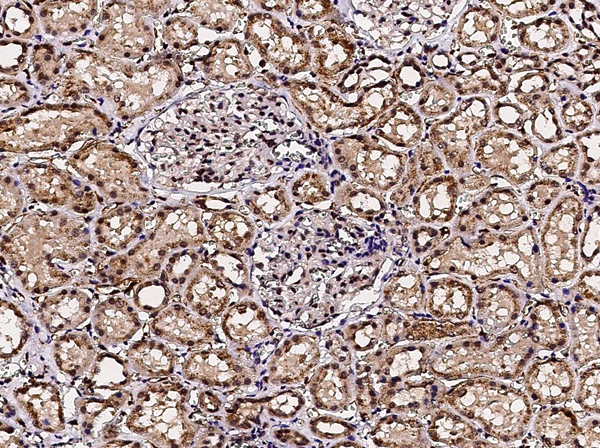 IHC (Immunohiostchemistry)
(Immunochemical staining of human ACOX1 in human kidney with rabbit monoclonal antibody (1:200, formalin-fixed paraffin embedded sections). Positive staining was localized to proximal tubule.)
IHC (Immunohiostchemistry)
(Immunochemical staining of human ACOX1 in human kidney with rabbit monoclonal antibody (1:200, formalin-fixed paraffin embedded sections). Positive staining was localized to proximal tubule.)
ACOX1, Monoclonal Antibody (Cat# AAA255378)
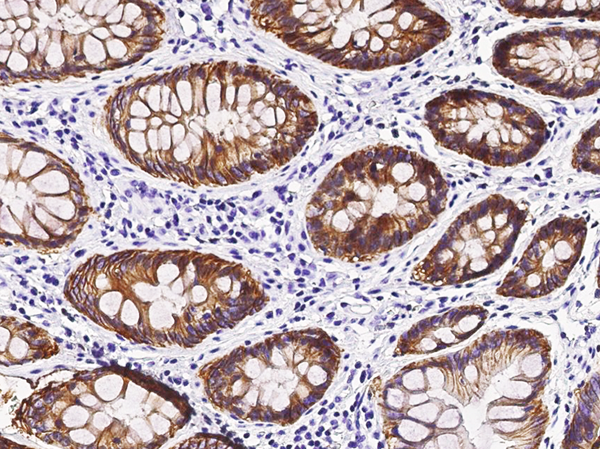
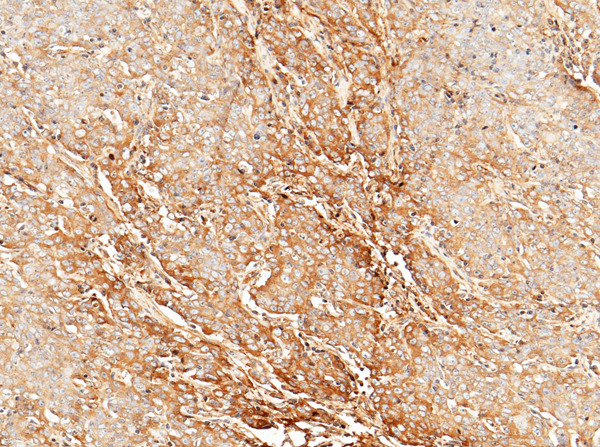
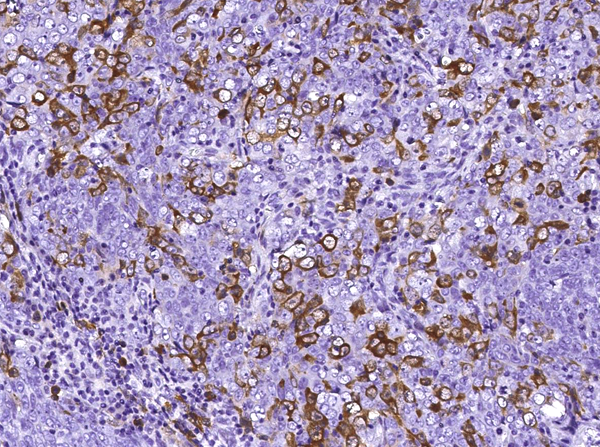
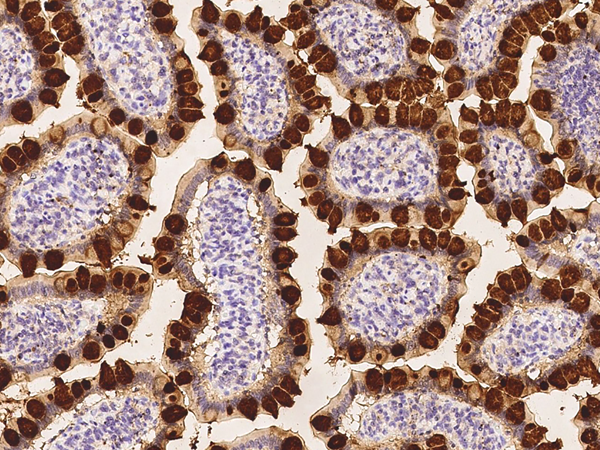
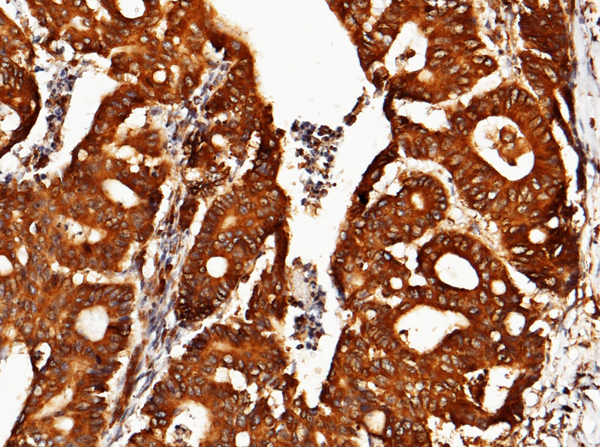
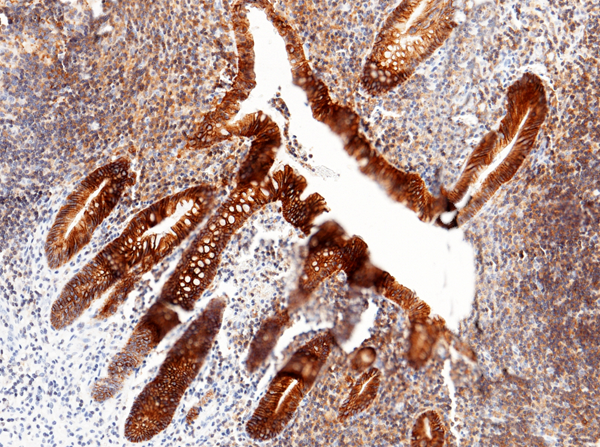
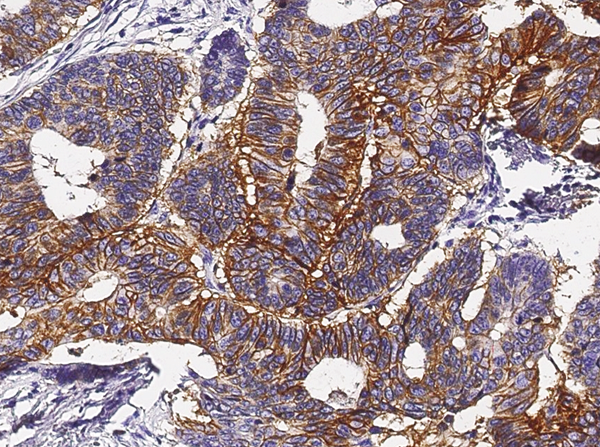 IHC (Immunohistochemisry)
(Immunochemical staining of human GPA33 in human colon carcinoma with rabbit monoclonal antibody (1:200, formalin-fixed paraffin embedded sections). Positive staining was localized to epithelium.)
IHC (Immunohistochemisry)
(Immunochemical staining of human GPA33 in human colon carcinoma with rabbit monoclonal antibody (1:200, formalin-fixed paraffin embedded sections). Positive staining was localized to epithelium.)
A33, Monoclonal Antibody (Cat# AAA255383)
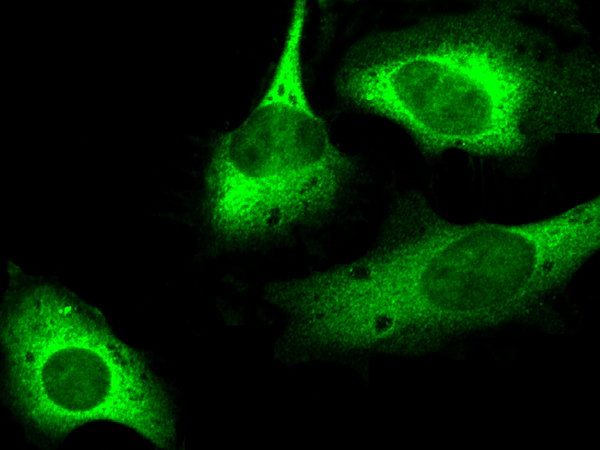
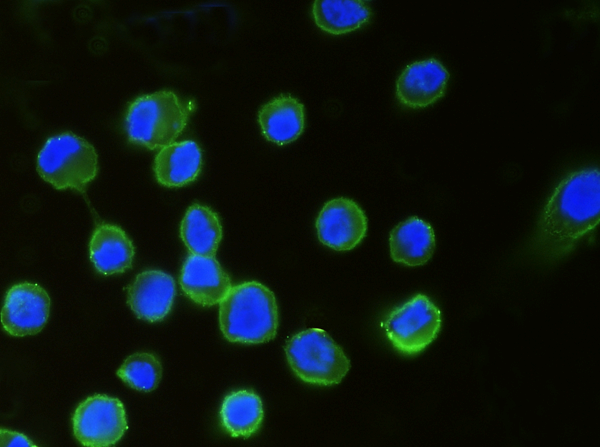
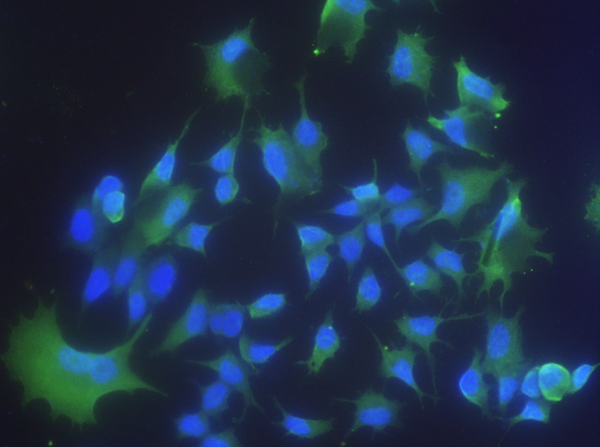
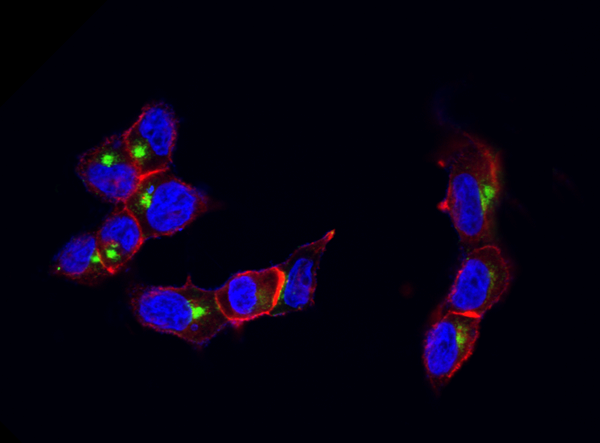
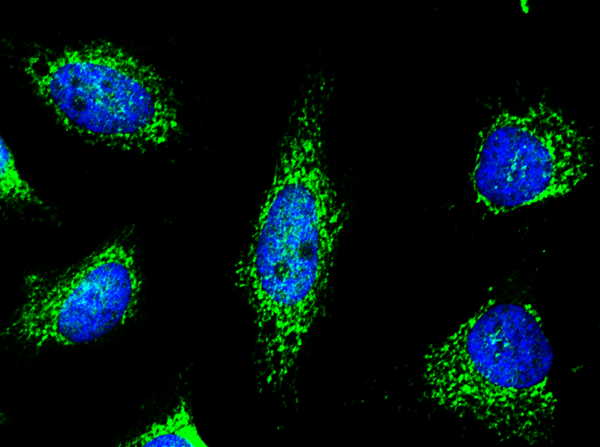
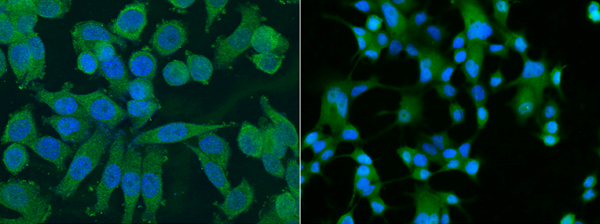
 IF (Immunofluorescence)
(Immunofluorescence staining of ORP150 in MCF7 cells. Cells were fixed with 4% PFA, permeabilzed with 0.1% Triton X-100 in PBS,blocked with 10% serum, and incubated with rabbit anti-Human ORP150 monoclonal antibody (dilution ratio 1:60) at 4 degree C overnight. Then cells were stained with the Alexa Fluor488-conjugated Goat Anti-rabbit IgG secondary antibody (green). Positive staining was localized to Cytoplasm.)
IF (Immunofluorescence)
(Immunofluorescence staining of ORP150 in MCF7 cells. Cells were fixed with 4% PFA, permeabilzed with 0.1% Triton X-100 in PBS,blocked with 10% serum, and incubated with rabbit anti-Human ORP150 monoclonal antibody (dilution ratio 1:60) at 4 degree C overnight. Then cells were stained with the Alexa Fluor488-conjugated Goat Anti-rabbit IgG secondary antibody (green). Positive staining was localized to Cytoplasm.)
ORP150, Monoclonal Antibody (Cat# AAA255404)
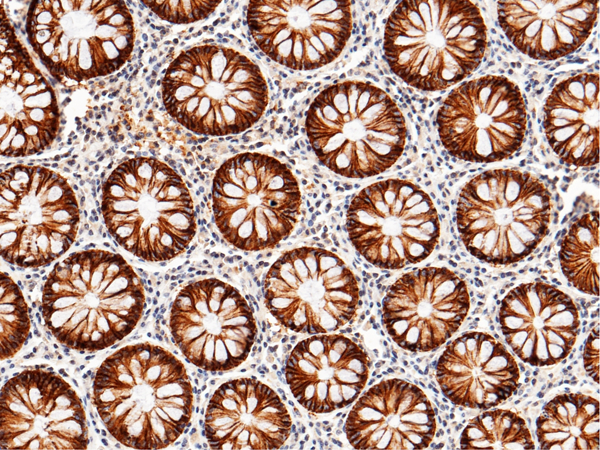
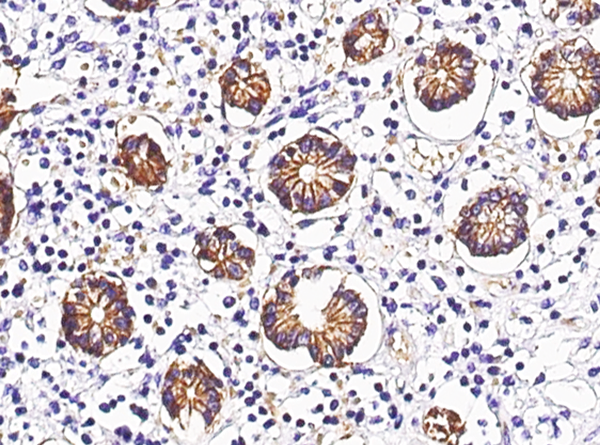
 IHC (Immunohistochemisry)
(Immunochemical staining of human CDH17 in human appendix with rabbit monoclonal antibody (1:200, formalin-fixed paraffin embedded sections). Positive staining was localized to intestinal gland.)
IHC (Immunohistochemisry)
(Immunochemical staining of human CDH17 in human appendix with rabbit monoclonal antibody (1:200, formalin-fixed paraffin embedded sections). Positive staining was localized to intestinal gland.)
Cadherin 17/CDH17, Monoclonal Antibody (Cat# AAA255407)

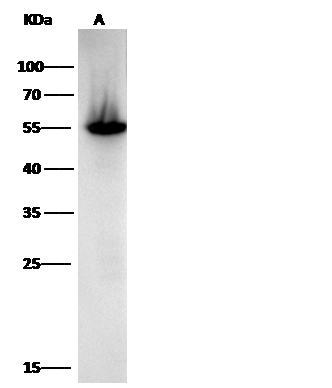 WB (Western Blot)
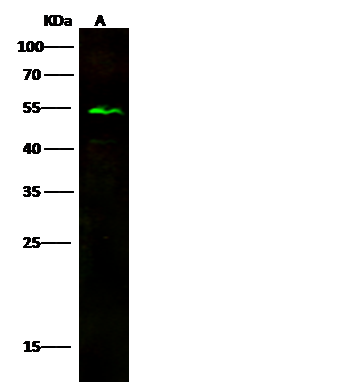
(Anti-ALDH1A1 mouse monoclonal antibody at 1:500 dilutionLane A: HepG2 Whole Cell LysateLysates/proteins at 30 ug per lane.SecondaryRabbit Anti-Mouse IgG F(ab)2/HRP at 1/10000 dilution.Developed using the ECL technique.Performed under reducing conditions.Predicted band size:55 kDaObserved band size:55 kDa)
WB (Western Blot)
(Anti-ALDH1A1 mouse monoclonal antibody at 1:500 dilutionLane A: HepG2 Whole Cell LysateLysates/proteins at 30 ug per lane.SecondaryRabbit Anti-Mouse IgG F(ab)2/HRP at 1/10000 dilution.Developed using the ECL technique.Performed under reducing conditions.Predicted band size:55 kDaObserved band size:55 kDa)
ALDH1A1, Monoclonal Antibody (Cat# AAA255410)
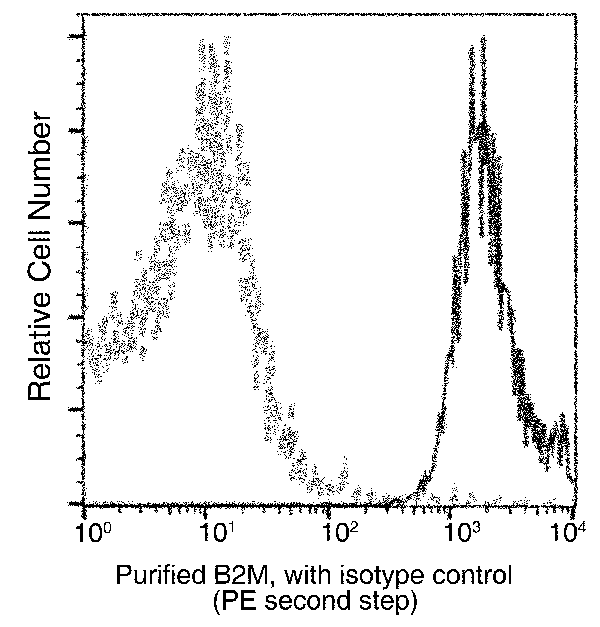 FCM/FACS (Flow Cytometry)
(Flow cytometric analysis of Human B2M / Beta-2-microglobulin expression on human whole blood lymphocytes. Cells were stained with purified anti-Human B2M / Beta-2-microglobulin, then a PE-conjugated second step antibody. The fluorescence histograms were derived from gated events with the forward and side light-scatter characteristics of viable lymphocytes.)
FCM/FACS (Flow Cytometry)
(Flow cytometric analysis of Human B2M / Beta-2-microglobulin expression on human whole blood lymphocytes. Cells were stained with purified anti-Human B2M / Beta-2-microglobulin, then a PE-conjugated second step antibody. The fluorescence histograms were derived from gated events with the forward and side light-scatter characteristics of viable lymphocytes.)
Beta-2 microglobulin, Monoclonal Antibody (Cat# AAA255495)
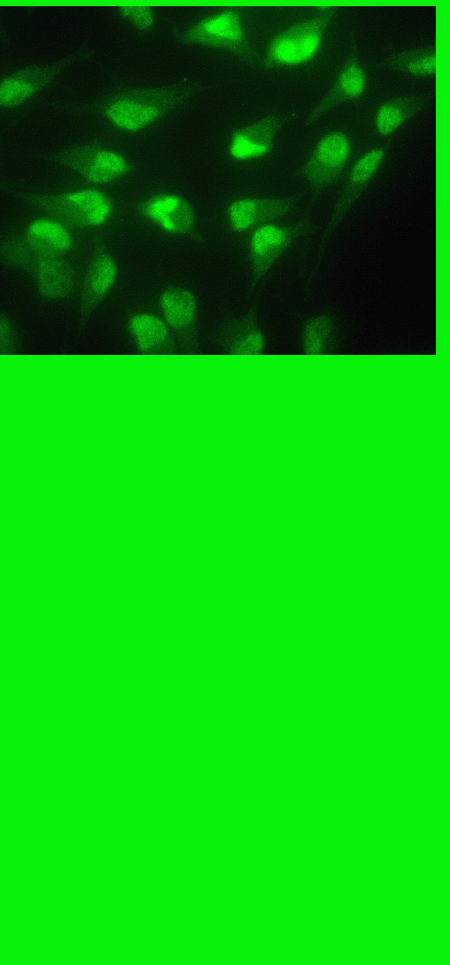
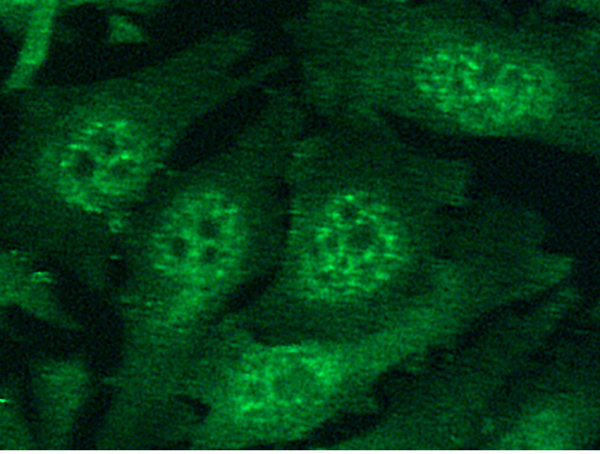 IF (Immunofluorescence)
(Immunofluorescence staining of Human HIF1A in Hela cells. Cells were fixed with 4% PFA, permeabilzed with 0.3% Triton X-100 in PBS, blocked with 10% serum, and incubated with rabbit anti-Human HIF1A monoclonal antibody (1:60) at 37 degree C 1 hour. Then cells were stained with the Alexa Fluor 488-conjugated Goat Anti-rabbit IgG secondary antibody (green). Positive staining was localized to nucleus and cytoplasm.)
IF (Immunofluorescence)
(Immunofluorescence staining of Human HIF1A in Hela cells. Cells were fixed with 4% PFA, permeabilzed with 0.3% Triton X-100 in PBS, blocked with 10% serum, and incubated with rabbit anti-Human HIF1A monoclonal antibody (1:60) at 37 degree C 1 hour. Then cells were stained with the Alexa Fluor 488-conjugated Goat Anti-rabbit IgG secondary antibody (green). Positive staining was localized to nucleus and cytoplasm.)
HIF-1 alpha, Monoclonal Antibody (Cat# AAA255498)
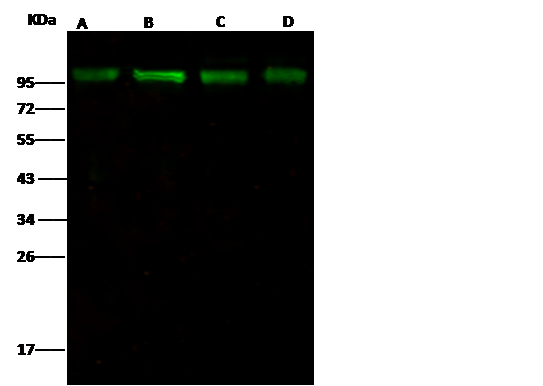
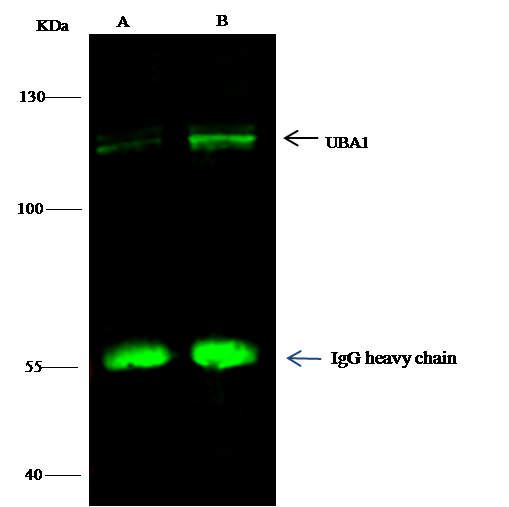 IP (Immunoprecipitation)
(UBA1 was immunoprecipitated using:Lane A:0.5 mg Hela Whole Cell LysateLane B:0.5 mg K562 Whole Cell Lysate0.5 uL anti-UBA1 mouse monoclonal antibody and 60 ug of Immunomagnetic beads Protein G.Primary antibody:Anti-UBA1 mouse monoclonal antibody,at 1:500 dilutionSecondary antibody:Dylight 800-labeled antibody to Mouse IgG (H+L), at 1:7500 dilutionDeveloped using the odssey technique.Performed under reducing conditions.Predicted band size: 111 kDaObserved band size: 111 kDa)
IP (Immunoprecipitation)
(UBA1 was immunoprecipitated using:Lane A:0.5 mg Hela Whole Cell LysateLane B:0.5 mg K562 Whole Cell Lysate0.5 uL anti-UBA1 mouse monoclonal antibody and 60 ug of Immunomagnetic beads Protein G.Primary antibody:Anti-UBA1 mouse monoclonal antibody,at 1:500 dilutionSecondary antibody:Dylight 800-labeled antibody to Mouse IgG (H+L), at 1:7500 dilutionDeveloped using the odssey technique.Performed under reducing conditions.Predicted band size: 111 kDaObserved band size: 111 kDa)
Ubiquitin Activating Enzyme E1/UBA1, Monoclonal Antibody (Cat# AAA255500)
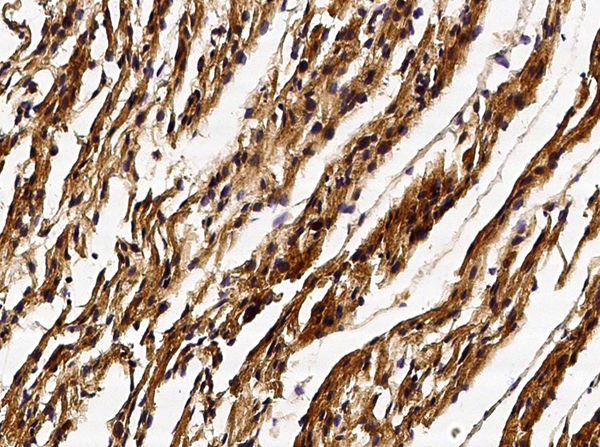
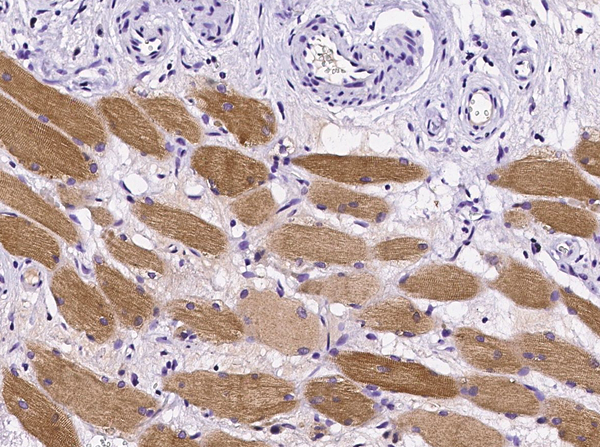
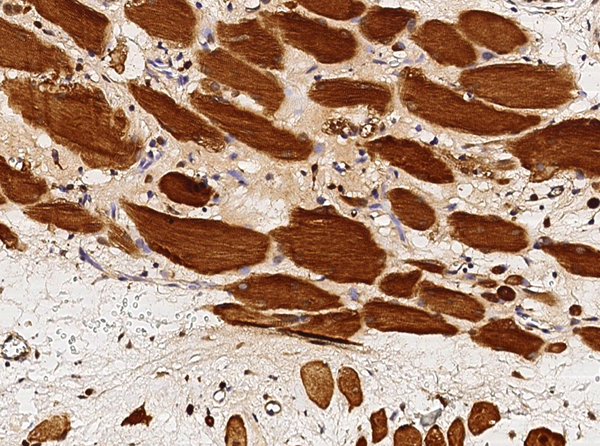 IHC (Immunohistochemisry)
(Immunochemical staining of human GSTM2 in human epididymis with rabbit monoclonal antibody (1:200, formalin-fixed paraffin embedded sections).Positive staining was localized to skeletal muscle.)
IHC (Immunohistochemisry)
(Immunochemical staining of human GSTM2 in human epididymis with rabbit monoclonal antibody (1:200, formalin-fixed paraffin embedded sections).Positive staining was localized to skeletal muscle.)
GSTM2, Monoclonal Antibody (Cat# AAA255504)
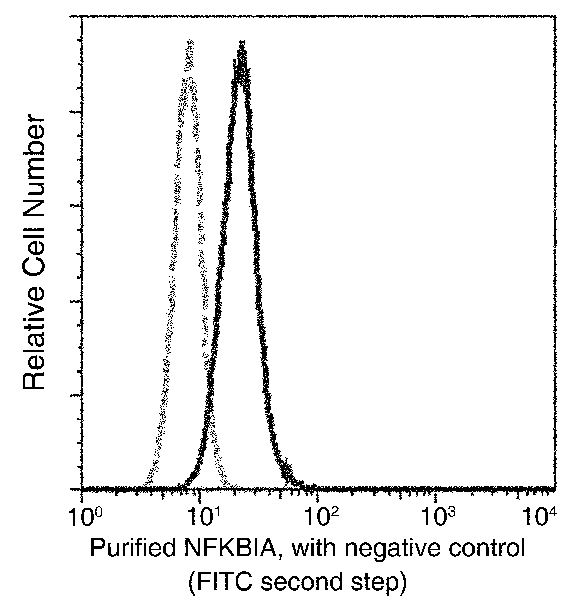 FCM/FACS (Flow Cytometry)
(Flow cytometric analysis of Human NFKBIA expression on HeLa cells. The cells were treated according to manufacturer's manual (BD Pharmingen'), stained with purified anti-Human NFKBIA, then a FITC-conjugated second step antibody. The fluorescence histograms were derived from gated events with the forward and side light-scatter characteristics of intact cells.)
FCM/FACS (Flow Cytometry)
(Flow cytometric analysis of Human NFKBIA expression on HeLa cells. The cells were treated according to manufacturer's manual (BD Pharmingen'), stained with purified anti-Human NFKBIA, then a FITC-conjugated second step antibody. The fluorescence histograms were derived from gated events with the forward and side light-scatter characteristics of intact cells.)
IkB alpha, Monoclonal Antibody (Cat# AAA255506)
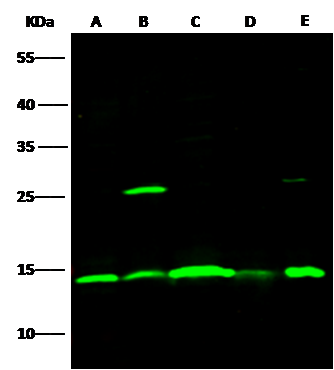
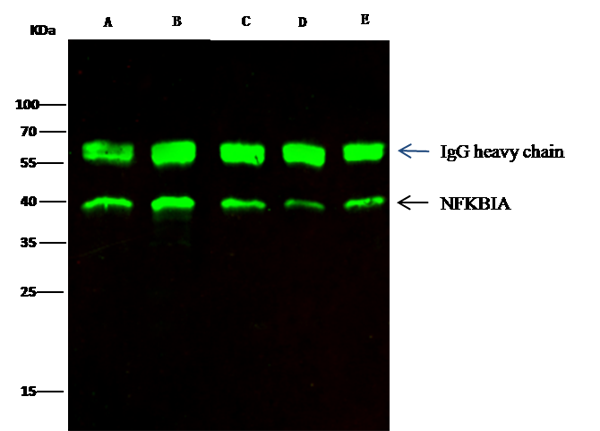 IP (Immunoprecipitation)
(NFKBIA was immunoprecipitated using:Lane A:0.5 mg HepG2 Whole Cell LysateLane B:0.5 mg 293T Whole Cell LysateLane C:0.5 mg A431 Whole Cell LysateLane D:0.5 mg Hela Whole Cell LysateLane E:0.5 mg K562 Whole Cell Lysate2 uL anti-NFKBIA rabbit monoclonal antibody and 15 ul of 50 % Protein G agarose.Primary antibody:Anti-NFKBIA rabbit monoclonal antibody,at 1:200 dilutionSecondary antibody:Dylight 800-labeled antibody to rabbit IgG (H+L), at 1:5000 dilutionDeveloped using the odssey technique.Performed under reducing conditions.Predicted band size: 36 kDaObserved band size: 36 kDa)
IP (Immunoprecipitation)
(NFKBIA was immunoprecipitated using:Lane A:0.5 mg HepG2 Whole Cell LysateLane B:0.5 mg 293T Whole Cell LysateLane C:0.5 mg A431 Whole Cell LysateLane D:0.5 mg Hela Whole Cell LysateLane E:0.5 mg K562 Whole Cell Lysate2 uL anti-NFKBIA rabbit monoclonal antibody and 15 ul of 50 % Protein G agarose.Primary antibody:Anti-NFKBIA rabbit monoclonal antibody,at 1:200 dilutionSecondary antibody:Dylight 800-labeled antibody to rabbit IgG (H+L), at 1:5000 dilutionDeveloped using the odssey technique.Performed under reducing conditions.Predicted band size: 36 kDaObserved band size: 36 kDa)
IkB alpha, Monoclonal Antibody (Cat# AAA255508)
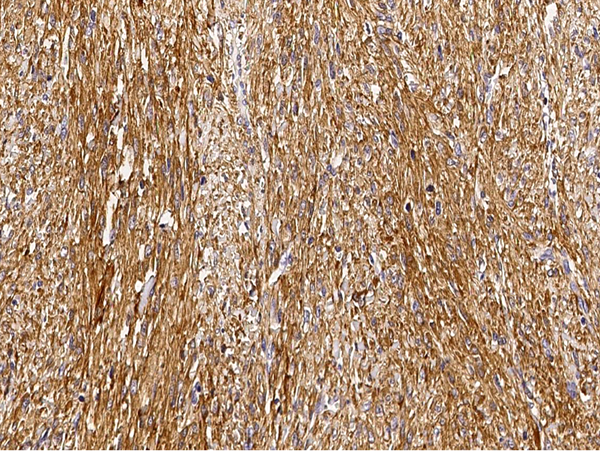
 IHC (Immunohiostchemistry)
(Immunochemical staining of human PNP in human kidney with rabbit monoclonal antibody (1:200, formalin-fixed paraffin embedded sections).)
IHC (Immunohiostchemistry)
(Immunochemical staining of human PNP in human kidney with rabbit monoclonal antibody (1:200, formalin-fixed paraffin embedded sections).)
Nucleoside phosphorylase/PNP, Monoclonal Antibody (Cat# AAA255516)
What are Monoclonal Antibodies?
Monoclonal antibodies are specialized laboratory-produced proteins developed for binding to specific biological antigens or other molecular targets. Since they come from a single cell (or clone), they are especially consistent and accurate in the data they are involved in producing.
This type of antibody material has been shown to be a powerful tool in finding and subsequently destroying harmful cells in an organism, such as those found in cancers or various autoimmune diseases. This makes them excellent aids in medical testing and research, which is why they are so widely used.
AAA Biotech offers a comprehensive range of high-quality monoclonal antibodies that perform effectively in various laboratory tests, including (amongst others) ELISA, western blotting, immunohistochemistry, and flow cytometry. All of the products in our catalog are thoroughly quality tested to make sure that they are reliable and will consistently perform well in your research.
What Are The Uses of Monoclonal Antibodies
Monoclonal antibodies are used in many lab tests, including (amongst others) ELISA, western blotting, immunohistochemistry, and flow cytometry.
ELISA is a test that helps detect a specific substance/analyte in a sample. It uses antibodies (often monoclonal) bound to a solid surface (such as the well of a microplate) to “capture” the substance/analyte in the sample and immobilize it so that the detection antibody component can then bind to it and produce a signal, which can then be measured.
Western blotting identifies specific proteins in a sample. The sample is first separated on a gel, and then antibodies are applied that will typically bind to the target, which will all be localized to a single band in a lane.
Immunohistochemistry helps locate specific proteins in cells or tissue samples using antibodies.
Flow cytometry looks at and sorts cells. It uses antibodies that are conjugated to reporter molecules called “fluorophores”, which, under special lights, emit light themselves, which can then be measured by a detector instrument.
How Monoclonal Antibodies Are Used as Medicine?
Please note that all of the products listed in AAA Biotech’s also known as AAA Bio or AAABio catalog are strictly for research-use only (RUO).
Monoclonal antibodies can also be used as therapeutic/medical treatments, particularly in the context of cancers. They are designed to find and bind to specific cells or proteins, helping the immune system recognize and attack the cancer. These treatments work in different ways, such as:
- Radioimmunotherapy attaches a small amount of radioactive molecule to the antibody, so it delivers the radiation directly to the cancer cells that the antibody is specifically binding to.
- Antibody-directed enzyme prodrug therapy uses antibodies that are specifically bound to special enzymes. These enzymes activate a harmless drug in the body and turn it into a cancer-killing drug only near the cancer cells—this helps avoid harming healthy cells.
- Immunoliposomes are tiny “bubbles” filled with medicine/drug and coated with antibodies. They carry the drug straight to the cancer cells.
Why Buy Monoclonal Antibodies From Us?
At AAA Biotech, we provide high-performance monoclonal antibodies designed to support a wide range of research needs.
1. Validated for Versatile Applications
The antibodies in our catalog are extensively validated and compatible with multiple techniques, including (but not limited to) ELISA, flow cytometry (FC), immunocytochemistry (ICC), immunofluorescence (IF), immunohistochemistry (IHC), immunoprecipitation (IP), and western blotting (WB).
2. Wide Selection & Specialized Options
We offer antibodies for common and rare species, that are available in various conjugated forms, and also in recombinant formats. Essentially, there is almost anything one might need to meet their experimental model’s requirements.
3. High-Quality Proteins
Our proteins meet high purity standards—90% or more as confirmed by SDS-PAGE. Many are available with tags like His, Flag, GST, or MBP, and we also supply native and biologically active proteins for functional studies.
Frequently Asked Questions
1. Are your monoclonal antibodies validated for specific applications?
Yes, our antibodies are tested and validated for use in methods such as ELISA, western blot, IHC, flow cytometry, and more. Refer to specific product pages or datasheets for individual product information.
2. How do I choose the right monoclonal antibody for my application?
Review the product details directly for application validation, species reactivity, and target information. You may also contact our support team at any time for help.
3. How quickly can I receive my order?
Most orders are processed and shipped within 1–3 business days, depending on product availability and your shipping location.