Filters
▼Clonality
▼Type
▼Reactivity
▼Gene Name
▼Isotype
▼Host
▼Application
▼Clone
▼Monoclonal Antibodies
Get accurate results in your research with our Monoclonal Antibodies, which are specially made to target exactly what you require for your research, and will produce consistent, reliable performance in lab tests.
Viewing 4600-4650 of 27597 product results
 WB (Western Blot)
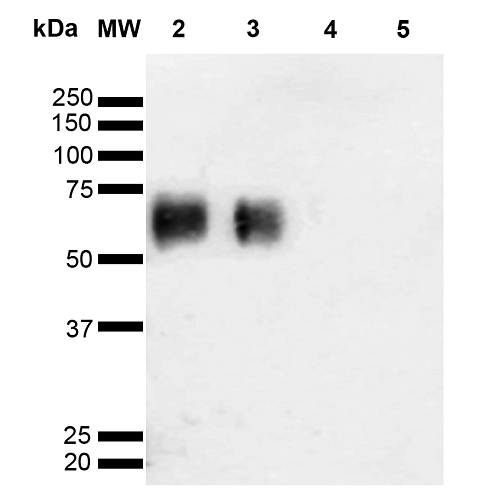
(Western Blot analysis of Glycoconjugates showing detection of 67 kDa O-GalNAC protein using Mouse Anti-O-GalNAC Monoclonal Antibody, Clone 9B9. Lane 1: Molecular Weight Ladder (MW). Lane 2: GlcNAc-BSA. Lane 3: GalNAc-BSA. Lane 4: Galactose-BSA. Lane 5: Glucose-BSA. Load: 2.0 ug. Block: 5% Skim Milk in TBST. Primary Antibody: Mouse Anti-O-GalNAC Monoclonal Antibody at 1:1000 for 2 hours at RT. Secondary Antibody: Goat Anti-Mouse IgG: HRP at 1:2000 for 60 min at RT. Color Development: ECL solution for 5 min in RT. Predicted/Observed Size: 67 kDa.)
WB (Western Blot)
(Western Blot analysis of Glycoconjugates showing detection of 67 kDa O-GalNAC protein using Mouse Anti-O-GalNAC Monoclonal Antibody, Clone 9B9. Lane 1: Molecular Weight Ladder (MW). Lane 2: GlcNAc-BSA. Lane 3: GalNAc-BSA. Lane 4: Galactose-BSA. Lane 5: Glucose-BSA. Load: 2.0 ug. Block: 5% Skim Milk in TBST. Primary Antibody: Mouse Anti-O-GalNAC Monoclonal Antibody at 1:1000 for 2 hours at RT. Secondary Antibody: Goat Anti-Mouse IgG: HRP at 1:2000 for 60 min at RT. Color Development: ECL solution for 5 min in RT. Predicted/Observed Size: 67 kDa.)
O-GalNAc, Monoclonal Antibody (Cat# AAA103990)
 FCM/FACS (Flow Cytometry)
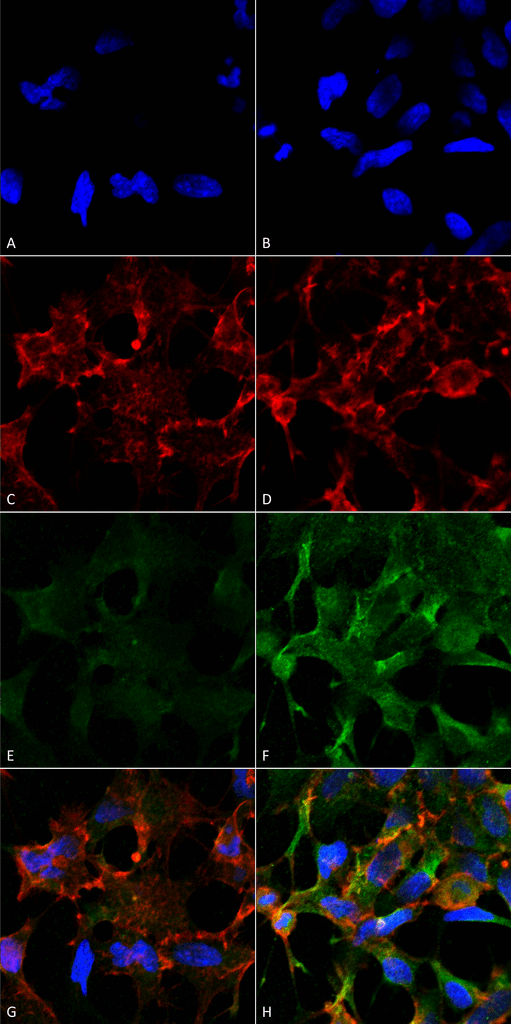
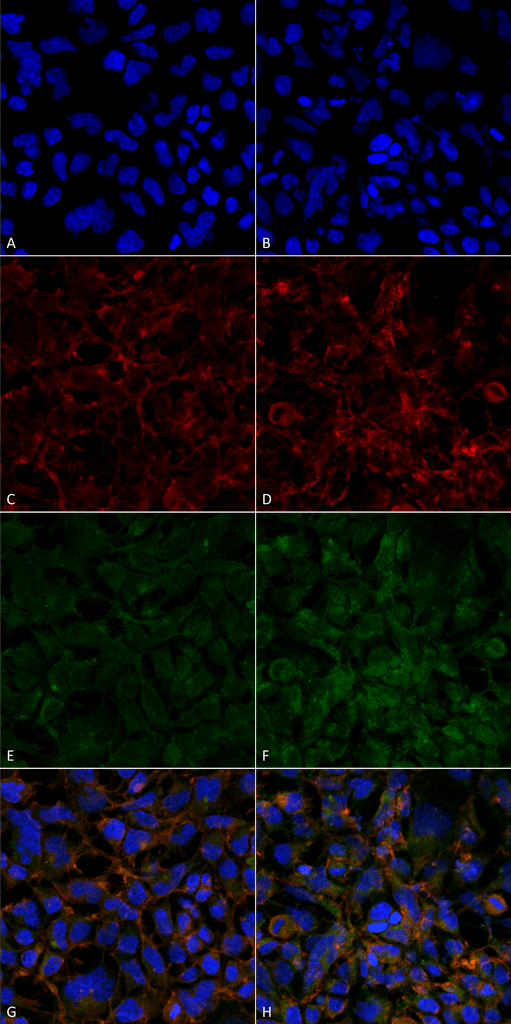
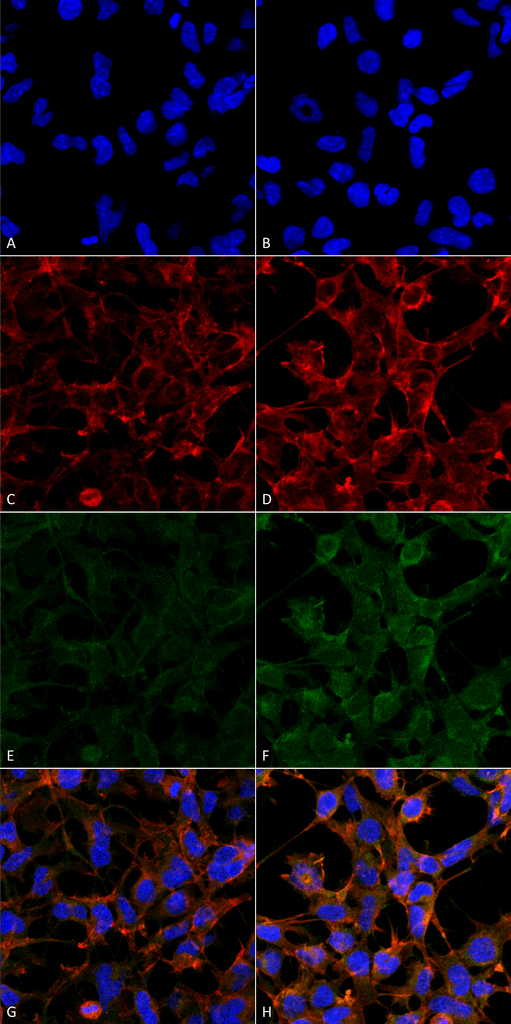
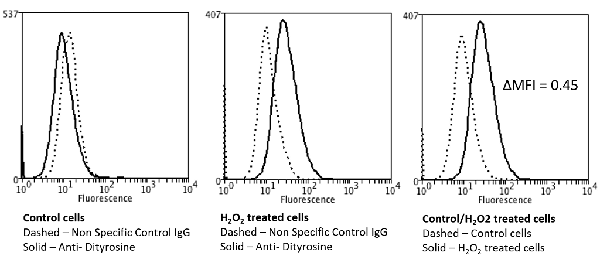
(Flow Cytometry analysis using Mouse Anti-Acrolein Monoclonal Antibody, Clone 2H2. Tissue: Neuroblastoma cells (SH-SY5Y). Species: Human. Fixation: 90% Methanol. Primary Antibody: Mouse Anti-Acrolein Monoclonal Antibody at 1:50 for 30 min on ice. Secondary Antibody: Goat Anti-Mouse: PE at 1:100 for 20 min at RT. Isotype Control: Non Specific IgG. Cells were subject to oxidative stress by treating with 250 uM H2O2 for 24 hours.)
FCM/FACS (Flow Cytometry)
(Flow Cytometry analysis using Mouse Anti-Acrolein Monoclonal Antibody, Clone 2H2. Tissue: Neuroblastoma cells (SH-SY5Y). Species: Human. Fixation: 90% Methanol. Primary Antibody: Mouse Anti-Acrolein Monoclonal Antibody at 1:50 for 30 min on ice. Secondary Antibody: Goat Anti-Mouse: PE at 1:100 for 20 min at RT. Isotype Control: Non Specific IgG. Cells were subject to oxidative stress by treating with 250 uM H2O2 for 24 hours.)
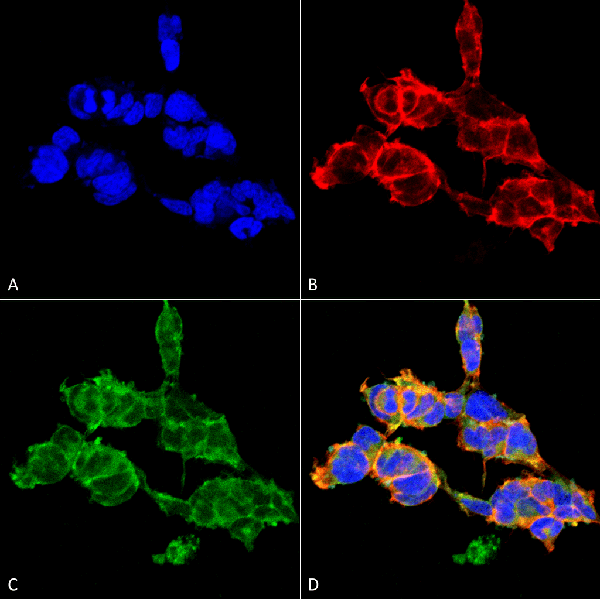
Acrolein, Monoclonal Antibody (Cat# AAA103995)


 FCM/FACS (Flow Cytometry)
(Flow Cytometry analysis using Mouse Anti-Acrolein Monoclonal Antibody, Clone 2H2. Tissue: Neuroblastoma cells (SH-SY5Y). Species: Human. Fixation: 90% Methanol. Primary Antibody: Mouse Anti-Acrolein Monoclonal Antibody at 1:50 for 30 min on ice. Secondary Antibody: Goat Anti-Mouse: PE at 1:100 for 20 min at RT. Isotype Control: Non Specific IgG. Cells were subject to oxidative stress by treating with 250 uM H2O2 for 24 hours.)
FCM/FACS (Flow Cytometry)
(Flow Cytometry analysis using Mouse Anti-Acrolein Monoclonal Antibody, Clone 2H2. Tissue: Neuroblastoma cells (SH-SY5Y). Species: Human. Fixation: 90% Methanol. Primary Antibody: Mouse Anti-Acrolein Monoclonal Antibody at 1:50 for 30 min on ice. Secondary Antibody: Goat Anti-Mouse: PE at 1:100 for 20 min at RT. Isotype Control: Non Specific IgG. Cells were subject to oxidative stress by treating with 250 uM H2O2 for 24 hours.)
Acrolein, Monoclonal Antibody (Cat# AAA104002)
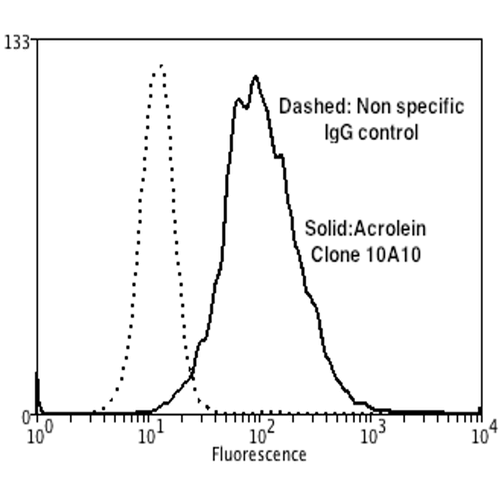
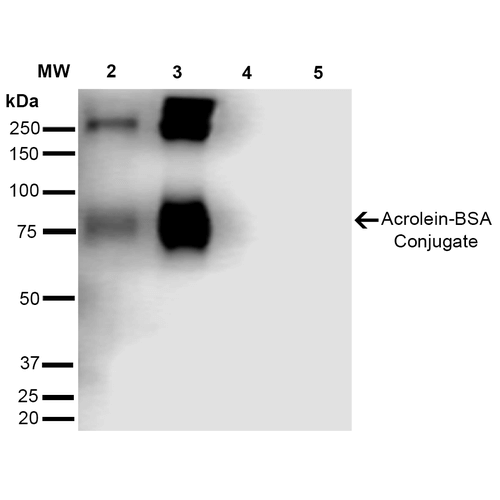
 WB (Western Blot)
(Western Blot analysis of Human Cervical cancer cell line (HeLa) lysate showing detection of Acrolein protein using Mouse Anti-Acrolein Monoclonal Antibody, Clone 10A10. Lane 1: Molecular Weight Ladder (MW). Lane 2: HeLa cell lysate. Lane 3: H2O2 treated HeLa cell lysate. Load: 12 ug. Block: 5% Skim Milk in TBST. Primary Antibody: Mouse Anti-Acrolein Monoclonal Antibody at 1:1000 for 2 hours at RT. Secondary Antibody: Goat Anti-Mouse IgG: HRP at 1:2000 for 60 min at RT. Color Development: ECL solution for 5 min in RT.)
WB (Western Blot)
(Western Blot analysis of Human Cervical cancer cell line (HeLa) lysate showing detection of Acrolein protein using Mouse Anti-Acrolein Monoclonal Antibody, Clone 10A10. Lane 1: Molecular Weight Ladder (MW). Lane 2: HeLa cell lysate. Lane 3: H2O2 treated HeLa cell lysate. Load: 12 ug. Block: 5% Skim Milk in TBST. Primary Antibody: Mouse Anti-Acrolein Monoclonal Antibody at 1:1000 for 2 hours at RT. Secondary Antibody: Goat Anti-Mouse IgG: HRP at 1:2000 for 60 min at RT. Color Development: ECL solution for 5 min in RT.)
Acrolein, Monoclonal Antibody (Cat# AAA104006)


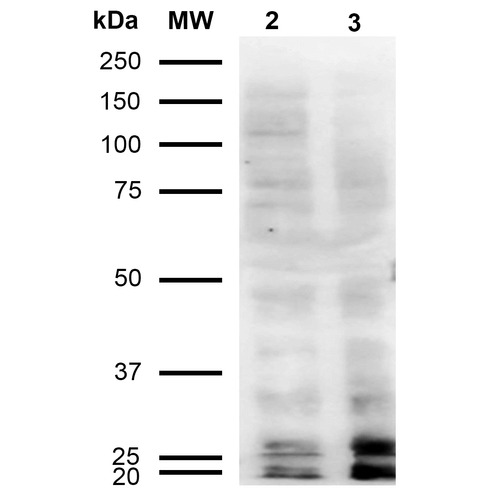
 WB (Western Blot)
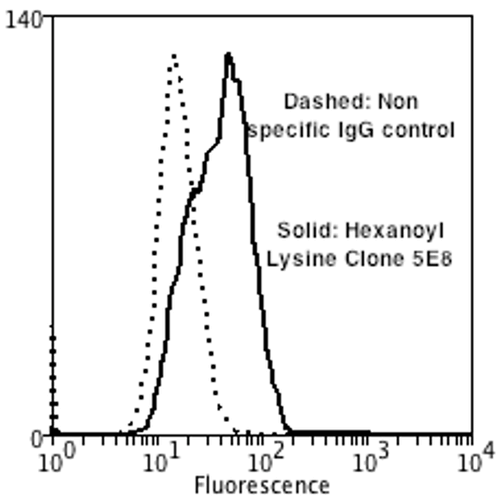
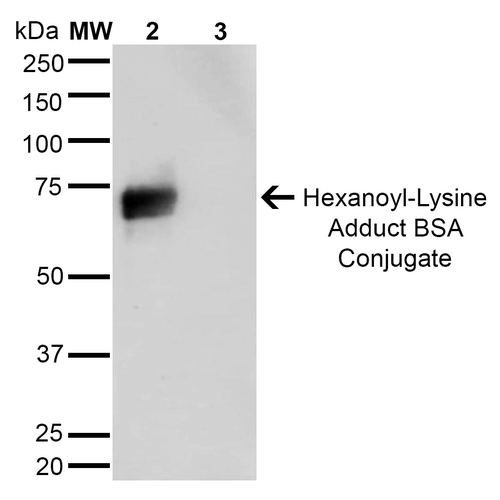
(Western Blot analysis of Human Cervical cancer cell line (HeLa) lysate showing detection of Hexanoyl-Lysine adduct protein using Mouse Anti-Hexanoyl-Lysine adduct Monoclonal Antibody, Clone 5E8. Lane 1: Molecular Weight Ladder (MW). Lane 2: HeLa cell lysate. Lane 3: H2O2 treated HeLa cell lysate. Load: 12 ug. Block: 5% Skim Milk in TBST. Primary Antibody: Mouse Anti-Hexanoyl-Lysine adduct Monoclonal Antibody at 1:1000 for 2 hours at RT. Secondary Antibody: Goat Anti-Mouse IgG: HRP at 1:2000 for 60 min at RT. Color Development: ECL solution for 5 min in RT.)
WB (Western Blot)
(Western Blot analysis of Human Cervical cancer cell line (HeLa) lysate showing detection of Hexanoyl-Lysine adduct protein using Mouse Anti-Hexanoyl-Lysine adduct Monoclonal Antibody, Clone 5E8. Lane 1: Molecular Weight Ladder (MW). Lane 2: HeLa cell lysate. Lane 3: H2O2 treated HeLa cell lysate. Load: 12 ug. Block: 5% Skim Milk in TBST. Primary Antibody: Mouse Anti-Hexanoyl-Lysine adduct Monoclonal Antibody at 1:1000 for 2 hours at RT. Secondary Antibody: Goat Anti-Mouse IgG: HRP at 1:2000 for 60 min at RT. Color Development: ECL solution for 5 min in RT.)
Hexanoyl-Lysine adduct, Monoclonal Antibody (Cat# AAA104026)
 WB (Western Blot)
(Western Blot analysis of Human Cervical cancer cell line (HeLa) lysate showing detection of Hexanoyl-Lysine adduct protein using Mouse Anti-Hexanoyl-Lysine adduct Monoclonal Antibody, Clone 5E8. Lane 1: Molecular Weight Ladder (MW). Lane 2: HeLa cell lysate. Lane 3: H2O2 treated HeLa cell lysate. Load: 12 ug. Block: 5% Skim Milk in TBST. Primary Antibody: Mouse Anti-Hexanoyl-Lysine adduct Monoclonal Antibody at 1:1000 for 2 hours at RT. Secondary Antibody: Goat Anti-Mouse IgG: HRP at 1:2000 for 60 min at RT. Color Development: ECL solution for 5 min in RT.)
WB (Western Blot)
(Western Blot analysis of Human Cervical cancer cell line (HeLa) lysate showing detection of Hexanoyl-Lysine adduct protein using Mouse Anti-Hexanoyl-Lysine adduct Monoclonal Antibody, Clone 5E8. Lane 1: Molecular Weight Ladder (MW). Lane 2: HeLa cell lysate. Lane 3: H2O2 treated HeLa cell lysate. Load: 12 ug. Block: 5% Skim Milk in TBST. Primary Antibody: Mouse Anti-Hexanoyl-Lysine adduct Monoclonal Antibody at 1:1000 for 2 hours at RT. Secondary Antibody: Goat Anti-Mouse IgG: HRP at 1:2000 for 60 min at RT. Color Development: ECL solution for 5 min in RT.)
Hexanoyl-Lysine adduct, Monoclonal Antibody (Cat# AAA104029)
 WB (Western Blot)
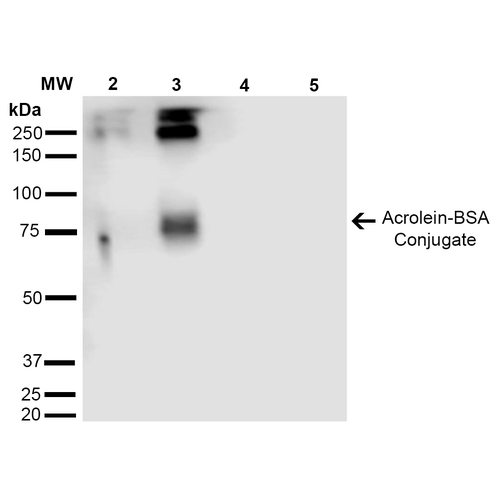
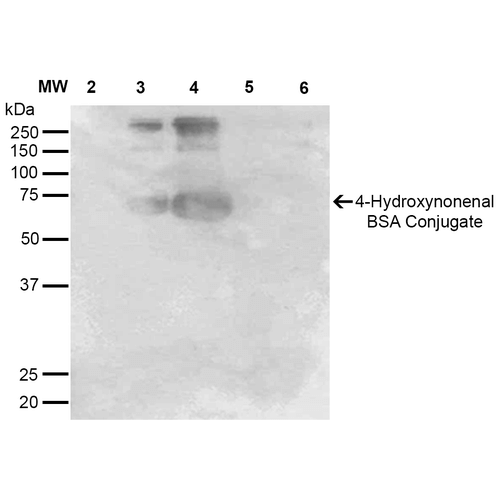
(Western Blot analysis of 4-hydroxy-nonenal-BSA Conjugate showing detection of 67 kDa 4-hydroxy-nonenal protein using Mouse Anti-4-hydroxy-nonenal Monoclonal Antibody, Clone 12F7. Lane 1: Molecular Weight Ladder (MW). Lane 2: BSA (0.5 ug). Lane 3: 4-hydroxyl nonenal-BSA (0.5 ug). Lane 4: 4-hydroxy nonenal-BSA (2.0 ug). Lane 5: 4-hydroxy-2-hexenal (0.5 ug). Lane 6: 4-hydroxy-2-hexenal (2.0 ug). Block: 5% Skim Milk in TBST. Primary Antibody: Mouse Anti-4-hydroxy-nonenal Monoclonal Antibody at 1:1000 for 2 hours at RT. Secondary Antibody: Goat Anti-Mouse IgG: HRP at 1:2000 for 60 min at RT. Color Development: ECL solution for 5 min in RT. Predicted/Observed Size: 67 kDa.)
WB (Western Blot)
(Western Blot analysis of 4-hydroxy-nonenal-BSA Conjugate showing detection of 67 kDa 4-hydroxy-nonenal protein using Mouse Anti-4-hydroxy-nonenal Monoclonal Antibody, Clone 12F7. Lane 1: Molecular Weight Ladder (MW). Lane 2: BSA (0.5 ug). Lane 3: 4-hydroxyl nonenal-BSA (0.5 ug). Lane 4: 4-hydroxy nonenal-BSA (2.0 ug). Lane 5: 4-hydroxy-2-hexenal (0.5 ug). Lane 6: 4-hydroxy-2-hexenal (2.0 ug). Block: 5% Skim Milk in TBST. Primary Antibody: Mouse Anti-4-hydroxy-nonenal Monoclonal Antibody at 1:1000 for 2 hours at RT. Secondary Antibody: Goat Anti-Mouse IgG: HRP at 1:2000 for 60 min at RT. Color Development: ECL solution for 5 min in RT. Predicted/Observed Size: 67 kDa.)
4-Hydroxynonenal, Monoclonal Antibody (Cat# AAA104042)
 WB (Western Blot)
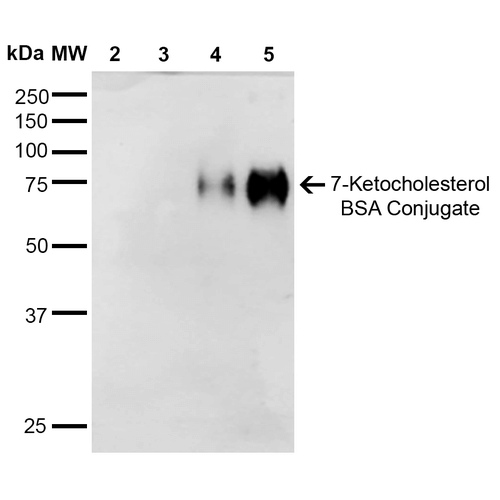
(Western Blot analysis of 7-Ketocholesterol-BSA Conjugate showing detection of 67 kDa 7-Ketocholesterol protein using Mouse Anti-7-Ketocholesterol Monoclonal Antibody, Clone 3F7. Lane 1: Molecular Weight Ladder (MW). Lane 2: BSA (0.5 ug). Lane 3: BSA (2.0 ug). Lane 4: 7-ketocholesterol-BSA (0.5 ug). Lane 5: 7-ketocholesterol-BSA (2.0 ug). Block: 5% Skim Milk in TBST. Primary Antibody: Mouse Anti-7-Ketocholesterol Monoclonal Antibody at 1:1000 for 2 hours at RT. Secondary Antibody: Goat Anti-Mouse IgG: HRP at 1:2000 for 60 min at RT. Color Development: ECL solution for 5 min in RT. Predicted/Observed Size: 67 kDa.)
WB (Western Blot)
(Western Blot analysis of 7-Ketocholesterol-BSA Conjugate showing detection of 67 kDa 7-Ketocholesterol protein using Mouse Anti-7-Ketocholesterol Monoclonal Antibody, Clone 3F7. Lane 1: Molecular Weight Ladder (MW). Lane 2: BSA (0.5 ug). Lane 3: BSA (2.0 ug). Lane 4: 7-ketocholesterol-BSA (0.5 ug). Lane 5: 7-ketocholesterol-BSA (2.0 ug). Block: 5% Skim Milk in TBST. Primary Antibody: Mouse Anti-7-Ketocholesterol Monoclonal Antibody at 1:1000 for 2 hours at RT. Secondary Antibody: Goat Anti-Mouse IgG: HRP at 1:2000 for 60 min at RT. Color Development: ECL solution for 5 min in RT. Predicted/Observed Size: 67 kDa.)
7-Ketocholesterol, Monoclonal Antibody (Cat# AAA104062)


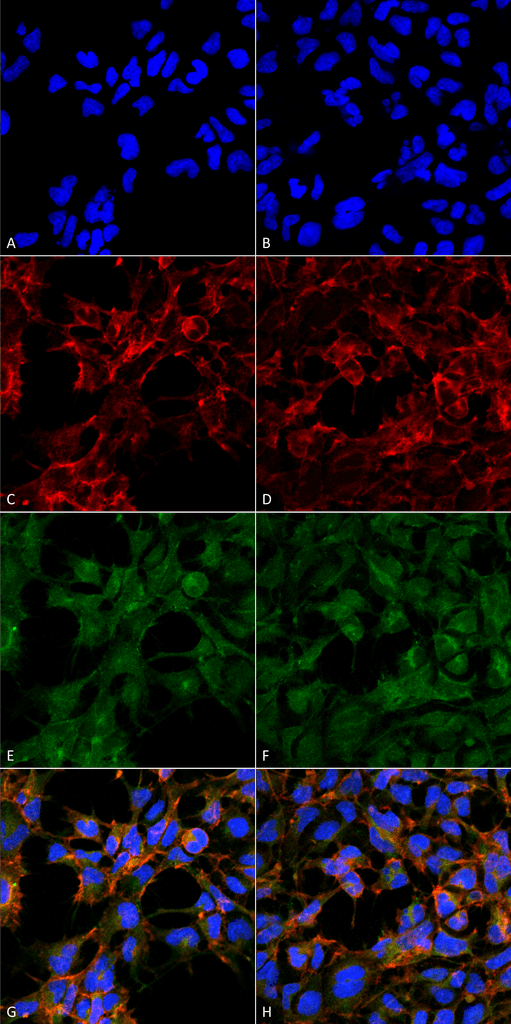
 FCM/FACS (Flow Cytometry)
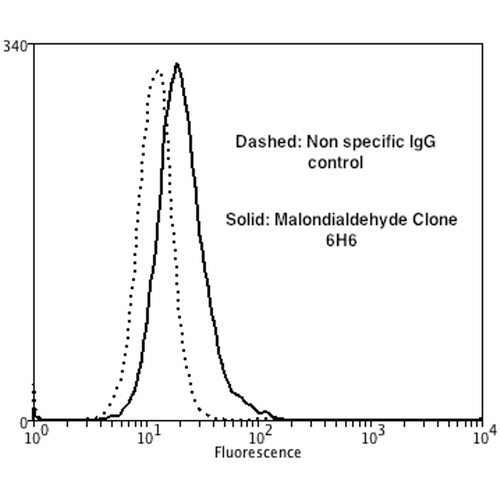
(Flow Cytometry analysis using Mouse Anti-Malondialdehyde Monoclonal Antibody, Clone 6H6. Tissue: Neuroblastoma cells (SH-SY5Y). Species: Human. Fixation: 90% Methanol. Primary Antibody: Mouse Anti-Malondialdehyde Monoclonal Antibody at 1:50 for 30 min on ice. Secondary Antibody: Goat Anti-Mouse: PE at 1:100 for 20 min at RT. Isotype Control: Non Specific IgG. Cells were subject to oxidative stress by treating with 250 uM H2O2 for 24 hours.)
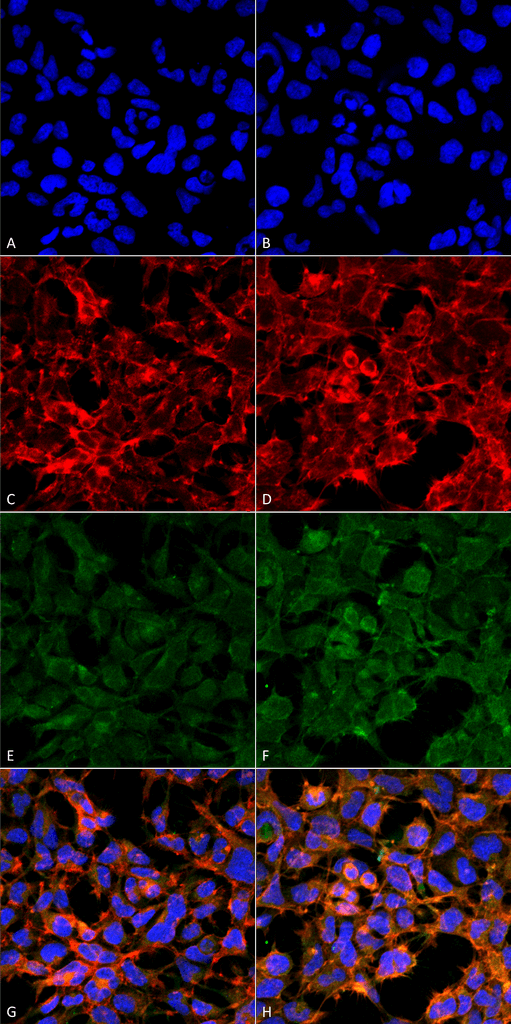
FCM/FACS (Flow Cytometry)
(Flow Cytometry analysis using Mouse Anti-Malondialdehyde Monoclonal Antibody, Clone 6H6. Tissue: Neuroblastoma cells (SH-SY5Y). Species: Human. Fixation: 90% Methanol. Primary Antibody: Mouse Anti-Malondialdehyde Monoclonal Antibody at 1:50 for 30 min on ice. Secondary Antibody: Goat Anti-Mouse: PE at 1:100 for 20 min at RT. Isotype Control: Non Specific IgG. Cells were subject to oxidative stress by treating with 250 uM H2O2 for 24 hours.)
Malondialdehyde, Monoclonal Antibody (Cat# AAA104068)
 FCM/FACS (Flow Cytometry)
(Flow Cytometry analysis using Mouse Anti-Malondialdehyde Monoclonal Antibody, Clone 6H6. Tissue: Neuroblastoma cells (SH-SY5Y). Species: Human. Fixation: 90% Methanol. Primary Antibody: Mouse Anti-Malondialdehyde Monoclonal Antibody at 1:50 for 30 min on ice. Secondary Antibody: Goat Anti-Mouse: PE at 1:100 for 20 min at RT. Isotype Control: Non Specific IgG. Cells were subject to oxidative stress by treating with 250 uM H2O2 for 24 hours.)
FCM/FACS (Flow Cytometry)
(Flow Cytometry analysis using Mouse Anti-Malondialdehyde Monoclonal Antibody, Clone 6H6. Tissue: Neuroblastoma cells (SH-SY5Y). Species: Human. Fixation: 90% Methanol. Primary Antibody: Mouse Anti-Malondialdehyde Monoclonal Antibody at 1:50 for 30 min on ice. Secondary Antibody: Goat Anti-Mouse: PE at 1:100 for 20 min at RT. Isotype Control: Non Specific IgG. Cells were subject to oxidative stress by treating with 250 uM H2O2 for 24 hours.)
Malondialdehyde, Monoclonal Antibody (Cat# AAA104069)
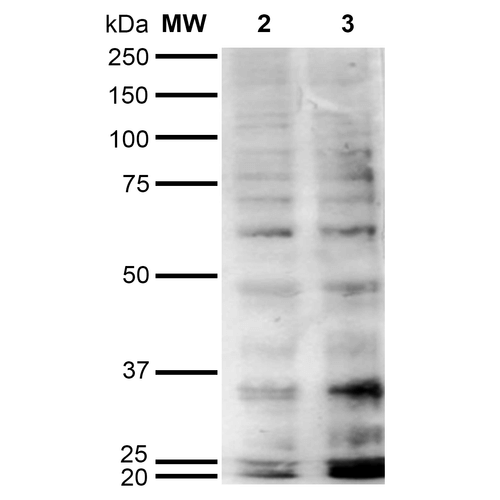
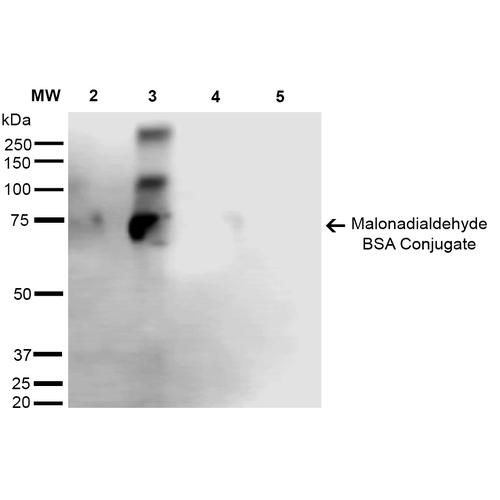
 WB (Western Blot)
(Western Blot analysis of Human Cervical cancer cell line (HeLa) lysate showing detection of Malondialdehyde protein using Mouse Anti-Malondialdehyde Monoclonal Antibody, Clone 11E3. Lane 1: Molecular Weight Ladder (MW). Lane 2: HeLa cell lysate. Lane 3: H2O2 treated HeLa cell lysate. Load: 12 ug. Block: 5% Skim Milk in TBST. Primary Antibody: Mouse Anti-Malondialdehyde Monoclonal Antibody at 1:1000 for 2 hours at RT. Secondary Antibody: Goat Anti-Mouse IgG: HRP at 1:2000 for 60 min at RT. Color Development: ECL solution for 5 min in RT.)
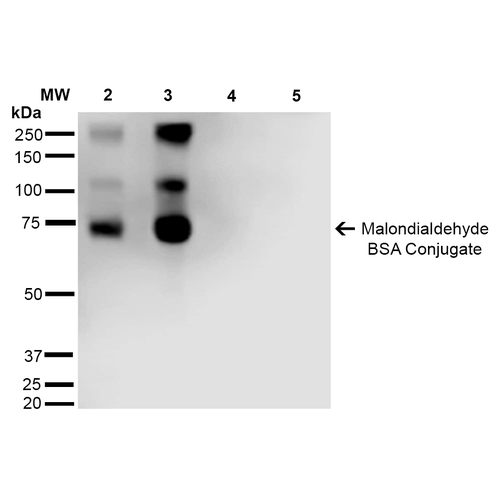
WB (Western Blot)
(Western Blot analysis of Human Cervical cancer cell line (HeLa) lysate showing detection of Malondialdehyde protein using Mouse Anti-Malondialdehyde Monoclonal Antibody, Clone 11E3. Lane 1: Molecular Weight Ladder (MW). Lane 2: HeLa cell lysate. Lane 3: H2O2 treated HeLa cell lysate. Load: 12 ug. Block: 5% Skim Milk in TBST. Primary Antibody: Mouse Anti-Malondialdehyde Monoclonal Antibody at 1:1000 for 2 hours at RT. Secondary Antibody: Goat Anti-Mouse IgG: HRP at 1:2000 for 60 min at RT. Color Development: ECL solution for 5 min in RT.)
Malondialdehyde, Monoclonal Antibody (Cat# AAA104081)
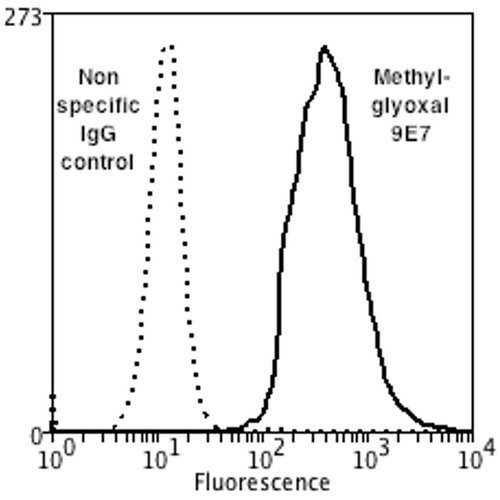 FCM/FACS (Flow Cytometry)
(Flow Cytometry analysis using Mouse Anti-Methylglyoxal Monoclonal Antibody, Clone 9E7. Tissue: Neuroblastoma cells (SH-SY5Y). Species: Human. Fixation: 90% Methanol. Primary Antibody: Mouse Anti-Methylglyoxal Monoclonal Antibody at 1:50 for 30 min on ice. Secondary Antibody: Goat Anti-Mouse: PE at 1:100 for 20 min at RT. Isotype Control: Non Specific IgG. Cells were subject to oxidative stress by treating with 250 uM H2O2 for 24 hours.)
FCM/FACS (Flow Cytometry)
(Flow Cytometry analysis using Mouse Anti-Methylglyoxal Monoclonal Antibody, Clone 9E7. Tissue: Neuroblastoma cells (SH-SY5Y). Species: Human. Fixation: 90% Methanol. Primary Antibody: Mouse Anti-Methylglyoxal Monoclonal Antibody at 1:50 for 30 min on ice. Secondary Antibody: Goat Anti-Mouse: PE at 1:100 for 20 min at RT. Isotype Control: Non Specific IgG. Cells were subject to oxidative stress by treating with 250 uM H2O2 for 24 hours.)
Methylglyoxal, Monoclonal Antibody (Cat# AAA104093)
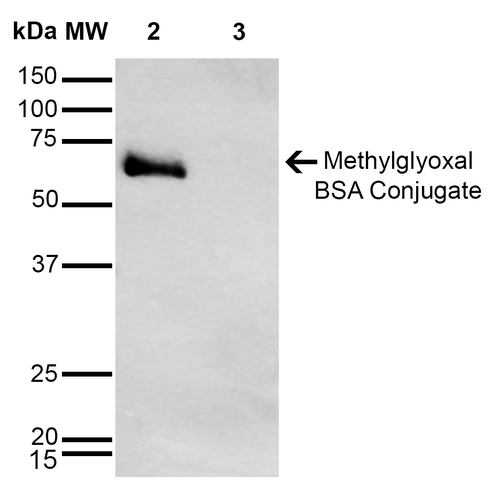
 WB (Western Blot)
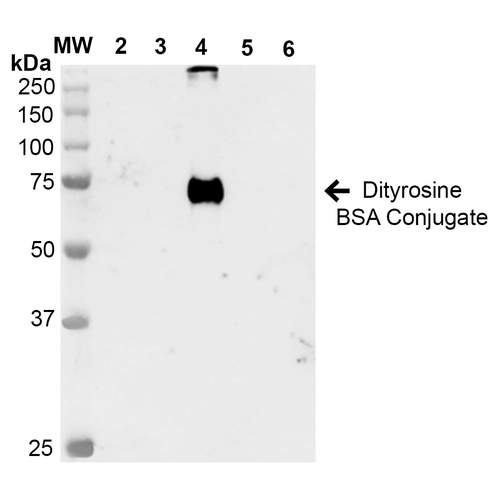
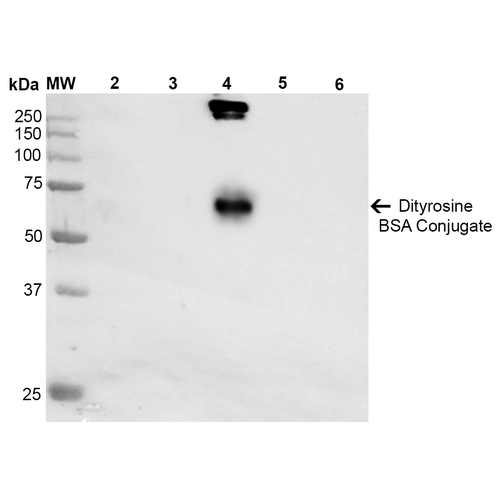
(Western Blot analysis of Dityrosine-BSA Conjugate showing detection of 67 kDa Dityrosine protein using Mouse Anti-Dityrosine Monoclonal Antibody, Clone 7D4. Lane 1: Molecular Weight Ladder (MW). Lane 2: BSA. Lane 3: 3,5-Dibromotyrosine-BSA. Lane 4: Dityrosine-BSA. Lane 5: Bromotyrosine-BSA. Lane 6: 7-ketocholesterol-BSA. Load: 1 ug. Block: 5% Skim Milk in TBST. Primary Antibody: Mouse Anti-Dityrosine Monoclonal Antibody at 1:1000 for 2 hours at RT. Secondary Antibody: Goat Anti-Mouse IgG: HRP at 1:2000 for 60 min at RT. Color Development: ECL solution for 5 min in RT. Predicted/Observed Size: 67 kDa.)
WB (Western Blot)
(Western Blot analysis of Dityrosine-BSA Conjugate showing detection of 67 kDa Dityrosine protein using Mouse Anti-Dityrosine Monoclonal Antibody, Clone 7D4. Lane 1: Molecular Weight Ladder (MW). Lane 2: BSA. Lane 3: 3,5-Dibromotyrosine-BSA. Lane 4: Dityrosine-BSA. Lane 5: Bromotyrosine-BSA. Lane 6: 7-ketocholesterol-BSA. Load: 1 ug. Block: 5% Skim Milk in TBST. Primary Antibody: Mouse Anti-Dityrosine Monoclonal Antibody at 1:1000 for 2 hours at RT. Secondary Antibody: Goat Anti-Mouse IgG: HRP at 1:2000 for 60 min at RT. Color Development: ECL solution for 5 min in RT. Predicted/Observed Size: 67 kDa.)
Dityrosine, Monoclonal Antibody (Cat# AAA104105)

 WB (Western Blot)
(Western Blot analysis of Dityrosine-BSA Conjugate showing detection of 67 kDa Dityrosine protein using Mouse Anti-Dityrosine Monoclonal Antibody, Clone 7D4. Lane 1: Molecular Weight Ladder (MW). Lane 2: BSA. Lane 3: 3,5-Dibromotyrosine-BSA. Lane 4: Dityrosine-BSA. Lane 5: Bromotyrosine-BSA. Lane 6: 7-ketocholesterol-BSA. Load: 1 ug. Block: 5% Skim Milk in TBST. Primary Antibody: Mouse Anti-Dityrosine Monoclonal Antibody at 1:1000 for 2 hours at RT. Secondary Antibody: Goat Anti-Mouse IgG: HRP at 1:2000 for 60 min at RT. Color Development: ECL solution for 5 min in RT. Predicted/Observed Size: 67 kDa.)
WB (Western Blot)
(Western Blot analysis of Dityrosine-BSA Conjugate showing detection of 67 kDa Dityrosine protein using Mouse Anti-Dityrosine Monoclonal Antibody, Clone 7D4. Lane 1: Molecular Weight Ladder (MW). Lane 2: BSA. Lane 3: 3,5-Dibromotyrosine-BSA. Lane 4: Dityrosine-BSA. Lane 5: Bromotyrosine-BSA. Lane 6: 7-ketocholesterol-BSA. Load: 1 ug. Block: 5% Skim Milk in TBST. Primary Antibody: Mouse Anti-Dityrosine Monoclonal Antibody at 1:1000 for 2 hours at RT. Secondary Antibody: Goat Anti-Mouse IgG: HRP at 1:2000 for 60 min at RT. Color Development: ECL solution for 5 min in RT. Predicted/Observed Size: 67 kDa.)
Dityrosine, Monoclonal Antibody (Cat# AAA104108)

 WB (Western Blot)
(Western Blot analysis of Dityrosine-BSA Conjugate showing detection of 67 kDa Dityrosine protein using Mouse Anti-Dityrosine Monoclonal Antibody, Clone 7D4. Lane 1: Molecular Weight Ladder (MW). Lane 2: BSA. Lane 3: 3,5-Dibromotyrosine-BSA. Lane 4: Dityrosine-BSA. Lane 5: Bromotyrosine-BSA. Lane 6: 7-ketocholesterol-BSA. Load: 1 ug. Block: 5% Skim Milk in TBST. Primary Antibody: Mouse Anti-Dityrosine Monoclonal Antibody at 1:1000 for 2 hours at RT. Secondary Antibody: Goat Anti-Mouse IgG: HRP at 1:2000 for 60 min at RT. Color Development: ECL solution for 5 min in RT. Predicted/Observed Size: 67 kDa.)
WB (Western Blot)
(Western Blot analysis of Dityrosine-BSA Conjugate showing detection of 67 kDa Dityrosine protein using Mouse Anti-Dityrosine Monoclonal Antibody, Clone 7D4. Lane 1: Molecular Weight Ladder (MW). Lane 2: BSA. Lane 3: 3,5-Dibromotyrosine-BSA. Lane 4: Dityrosine-BSA. Lane 5: Bromotyrosine-BSA. Lane 6: 7-ketocholesterol-BSA. Load: 1 ug. Block: 5% Skim Milk in TBST. Primary Antibody: Mouse Anti-Dityrosine Monoclonal Antibody at 1:1000 for 2 hours at RT. Secondary Antibody: Goat Anti-Mouse IgG: HRP at 1:2000 for 60 min at RT. Color Development: ECL solution for 5 min in RT. Predicted/Observed Size: 67 kDa.)
Dityrosine, Monoclonal Antibody (Cat# AAA104110)


 WB (Western Blot)
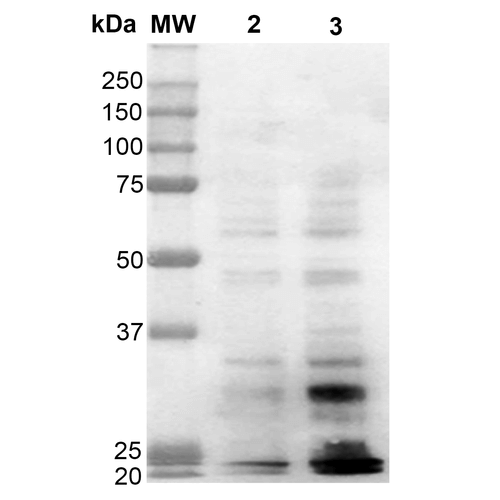
(Western Blot analysis of Human Cervical cancer cell line (HeLa) lysate showing detection of Dityrosine protein using Mouse Anti-Dityrosine Monoclonal Antibody, Clone 10A6. Lane 1: Molecular Weight Ladder (MW). Lane 2: HeLa cell lysate. Lane 3: H2O2 treated HeLa cell lysate. Load: 12 ug. Block: 5% Skim Milk in TBST. Primary Antibody: Mouse Anti-Dityrosine Monoclonal Antibody at 1:1000 for 2 hours at RT. Secondary Antibody: Goat Anti-Mouse IgG: HRP at 1:2000 for 60 min at RT. Color Development: ECL solution for 5 min in RT.)
WB (Western Blot)
(Western Blot analysis of Human Cervical cancer cell line (HeLa) lysate showing detection of Dityrosine protein using Mouse Anti-Dityrosine Monoclonal Antibody, Clone 10A6. Lane 1: Molecular Weight Ladder (MW). Lane 2: HeLa cell lysate. Lane 3: H2O2 treated HeLa cell lysate. Load: 12 ug. Block: 5% Skim Milk in TBST. Primary Antibody: Mouse Anti-Dityrosine Monoclonal Antibody at 1:1000 for 2 hours at RT. Secondary Antibody: Goat Anti-Mouse IgG: HRP at 1:2000 for 60 min at RT. Color Development: ECL solution for 5 min in RT.)
Dityrosine, Monoclonal Antibody (Cat# AAA104114)
 WB (Western Blot)
(Western Blot analysis of Human Cervical cancer cell line (HeLa) lysate showing detection of Dityrosine protein using Mouse Anti-Dityrosine Monoclonal Antibody, Clone 10A6. Lane 1: Molecular Weight Ladder (MW). Lane 2: HeLa cell lysate. Lane 3: H2O2 treated HeLa cell lysate. Load: 12 ug. Block: 5% Skim Milk in TBST. Primary Antibody: Mouse Anti-Dityrosine Monoclonal Antibody at 1:1000 for 2 hours at RT. Secondary Antibody: Goat Anti-Mouse IgG: HRP at 1:2000 for 60 min at RT. Color Development: ECL solution for 5 min in RT.)
WB (Western Blot)
(Western Blot analysis of Human Cervical cancer cell line (HeLa) lysate showing detection of Dityrosine protein using Mouse Anti-Dityrosine Monoclonal Antibody, Clone 10A6. Lane 1: Molecular Weight Ladder (MW). Lane 2: HeLa cell lysate. Lane 3: H2O2 treated HeLa cell lysate. Load: 12 ug. Block: 5% Skim Milk in TBST. Primary Antibody: Mouse Anti-Dityrosine Monoclonal Antibody at 1:1000 for 2 hours at RT. Secondary Antibody: Goat Anti-Mouse IgG: HRP at 1:2000 for 60 min at RT. Color Development: ECL solution for 5 min in RT.)
Dityrosine, Monoclonal Antibody (Cat# AAA104118)
 IHC (Immunohiostchemistry)
(IHC (1:100 400x) analysis of CAPZA1 expression in Liver Cancer with Anti-CAPZA1.)
IHC (Immunohiostchemistry)
(IHC (1:100 400x) analysis of CAPZA1 expression in Liver Cancer with Anti-CAPZA1.)
CAPZA1, Monoclonal Antibody (Cat# AAA108861)
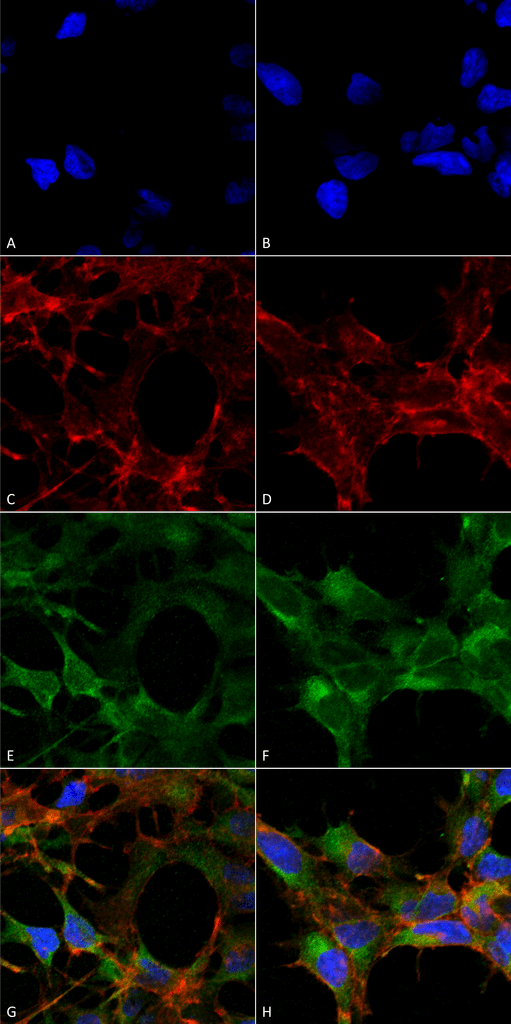
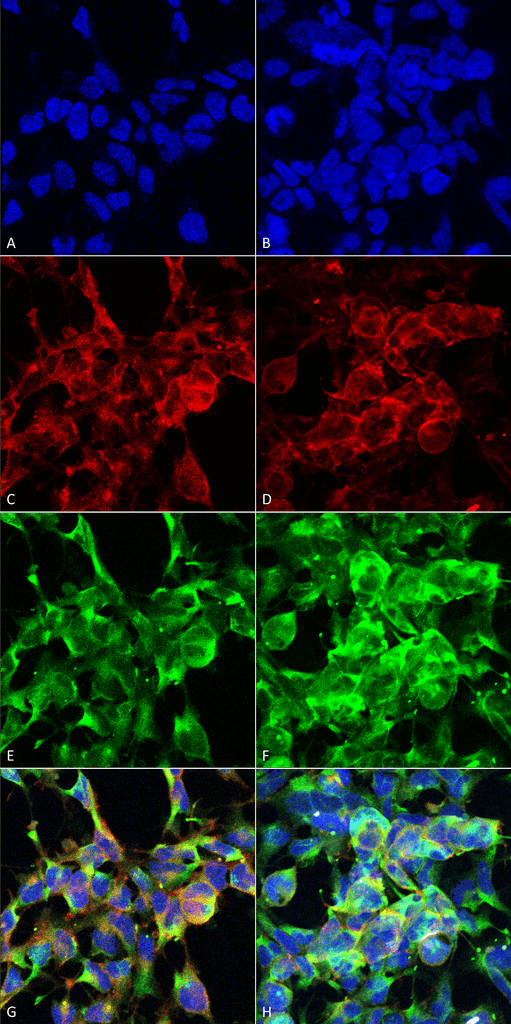
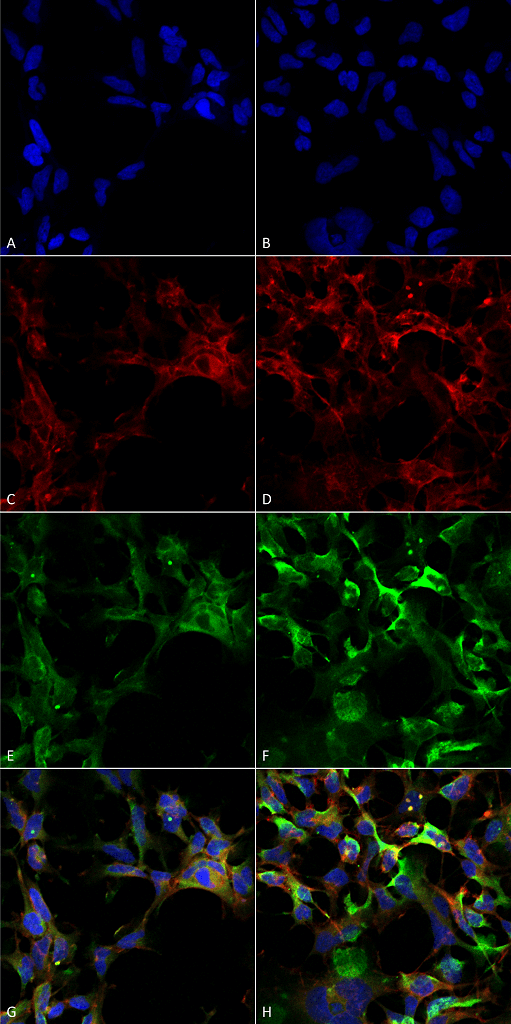
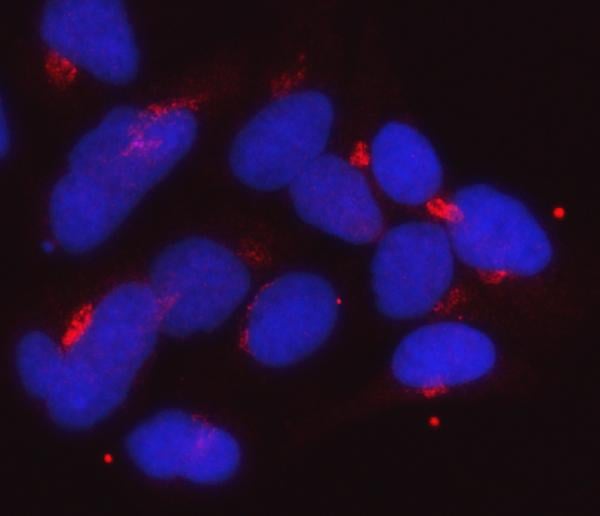
 IF (Immunofluorescence)
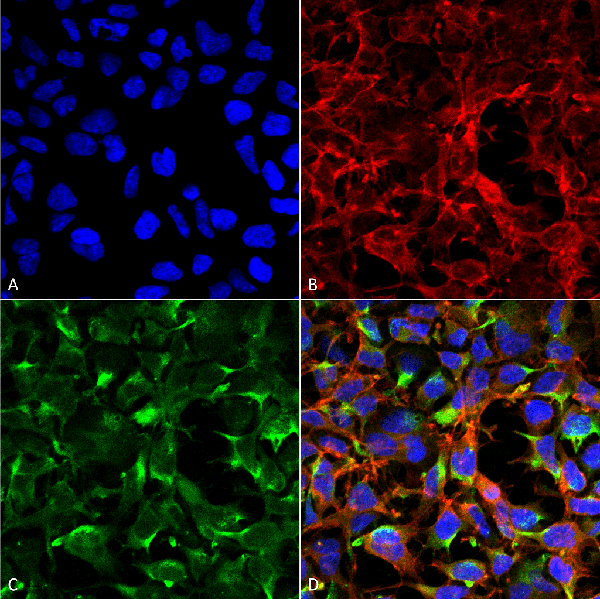
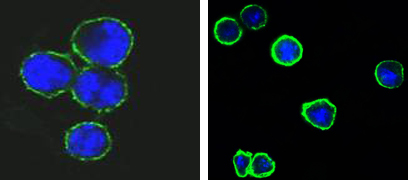
(Figure 1. Confocal immunofluorescence analysis of methanol-fixed BCBL-1 (left) and L1210 (right) cells using CD37 mouse mAb(green), showing membrane localization. Blue. DRAQ5 fluorescent DNA dye.)
IF (Immunofluorescence)
(Figure 1. Confocal immunofluorescence analysis of methanol-fixed BCBL-1 (left) and L1210 (right) cells using CD37 mouse mAb(green), showing membrane localization. Blue. DRAQ5 fluorescent DNA dye.)
CD37, Monoclonal Antibody (Cat# AAA108724)
 Application Data
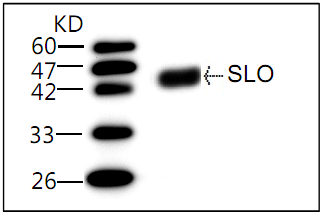
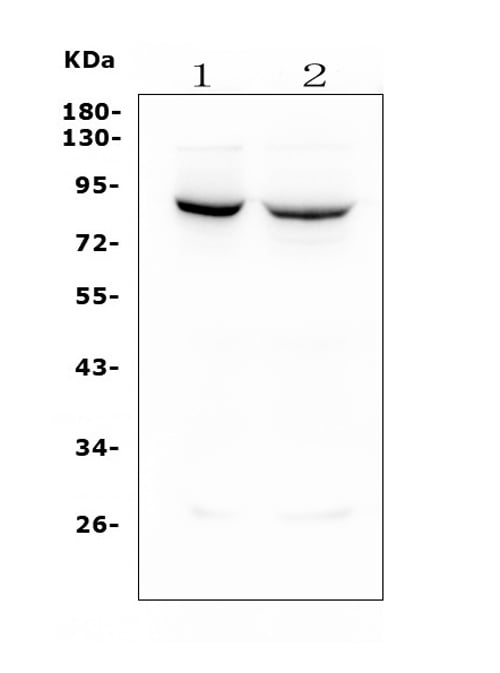
(WB (1:1000) analysis of recombinant protein HS SLO with Anti-HS SLO (AAA109011))
Application Data
(WB (1:1000) analysis of recombinant protein HS SLO with Anti-HS SLO (AAA109011))
HS SLO, Monoclonal Antibody (Cat# AAA109011)
Carcinoembryonic Antigen / CEA, Monoclonal Antibody (Cat# AAA77477)
CD11a (inhibitor), Monoclonal Antibody (Cat# AAA77510)
Mouse anti Human IgG2 (Fc subclass specific), Monoclonal Secondary Antibody (Cat# AAA77533)
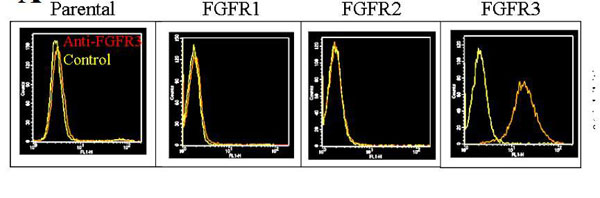
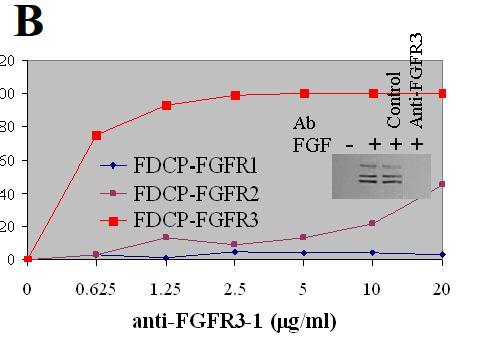 Application Data
FGFR-3 neutralizing antibody, Monoclonal Antibody (Cat# AAA79092)
 FCM/FACS (Flow Cytometry)
(FACS analysis with porcine aortic endothelial cells(PAE/Flt1) expressinghuman VEGFR-1/Flt-1)
FCM/FACS (Flow Cytometry)
(FACS analysis with porcine aortic endothelial cells(PAE/Flt1) expressinghuman VEGFR-1/Flt-1)
VEGFR-1/Flt-1, Monoclonal Antibody (Cat# AAA79095)
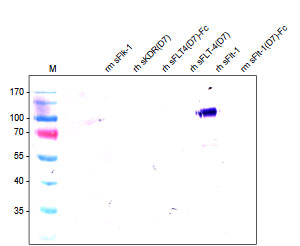
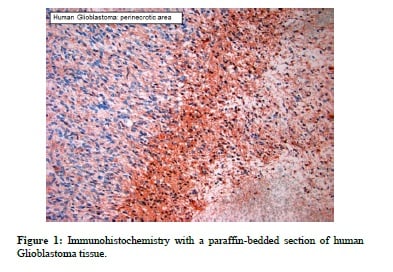
 Application Data
VEGFR-2/KDR, Monoclonal Antibody (Cat# AAA79099)
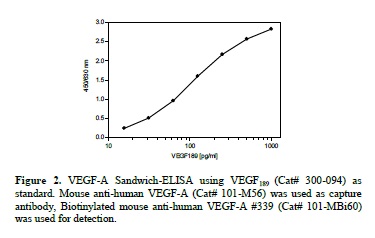
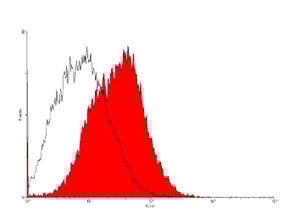
 Application Data
VEGF-A, Monoclonal Antibody (Cat# AAA79103)
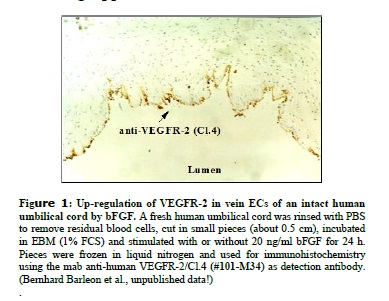
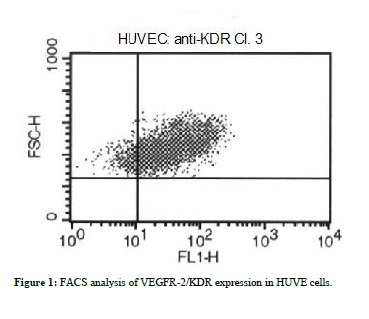
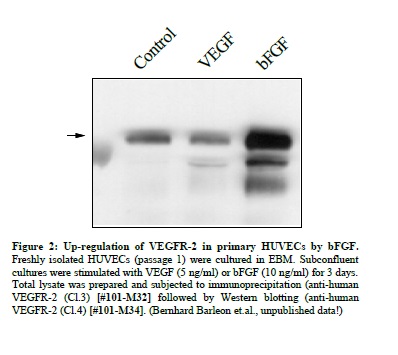 Application Data
VEGFR-2/KDR, Monoclonal Antibody (Cat# AAA79104)
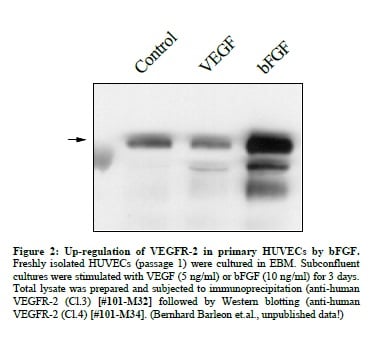
 Application Data
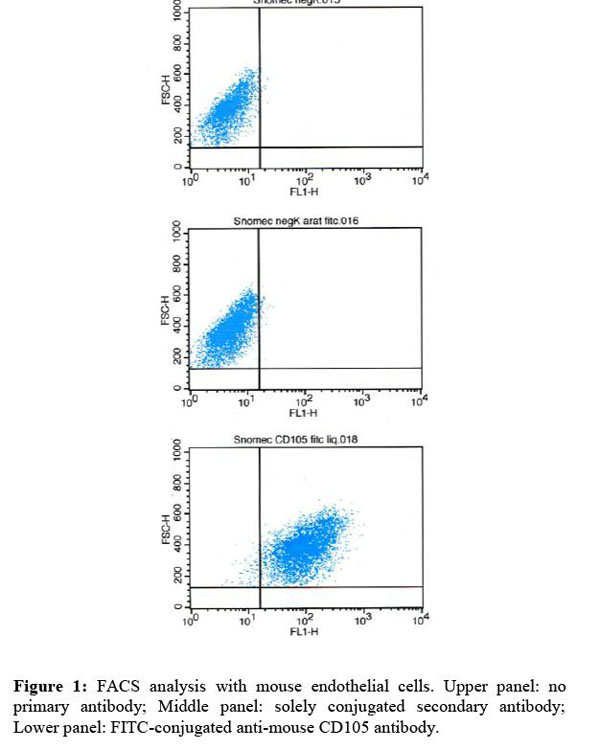
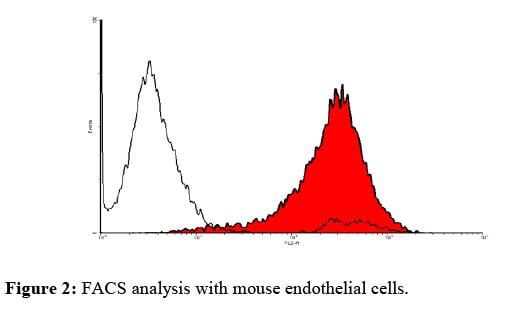
CD105/Endoglin, Monoclonal Antibody (Cat# AAA79106)
 IF (Immunofluorescence)
(Immunofluorescence Staining)
IF (Immunofluorescence)
(Immunofluorescence Staining)
Mouse Anti-Rat IgM (u chain specific), Monoclonal Secondary Antibody (Cat# AAA78695)
Mouse Anti-Rat Kappa (kappa chain specific), Monoclonal Secondary Antibody (Cat# AAA78698)
Distemper Virus, Monoclonal Antibody (Cat# AAA78054)
Fibrinogen, Monoclonal Antibody (Cat# AAA78076)
 IF (Immunofluorescence)
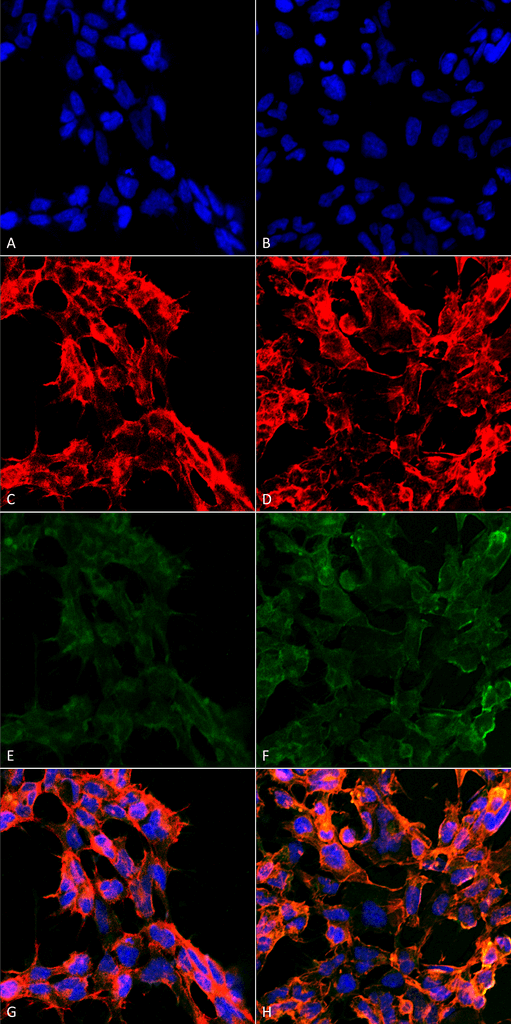
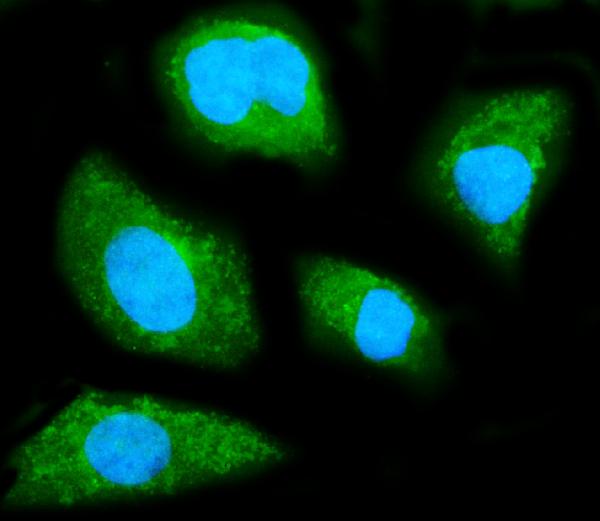
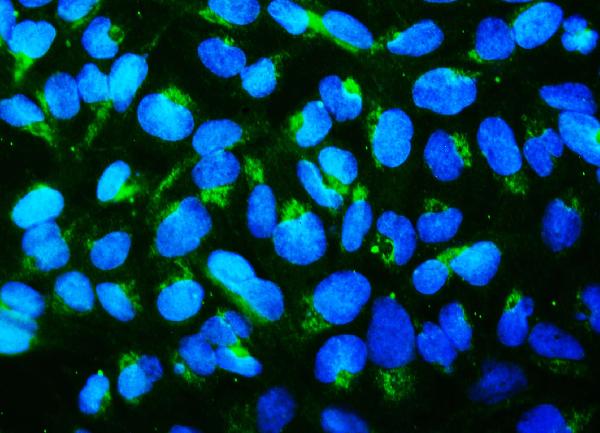
(Figure 2. IF analysis of GNB1 using anti-GNB1 antibody (AAA126938).GNB1 was detected in an immunocytochemical section of SiHa cells. Enzyme antigen retrieval was performed using IHC enzyme antigen retrieval reagent (AR0022) for 15 mins. The cells were blocked with 10% goat serum. And then incubated with 5 ug/mL mouse anti-GNB1 Antibody (AAA126938) overnight at 4 degree C. DyLight488 Conjugated Goat Anti-Mouse IgG was used as secondary antibody at 1:100 dilution and incubated for 30 minutes at 37 degree C. The section was counterstained with DAPI. Visualize using a fluorescence microscope and filter sets appropriate for the label used.)
IF (Immunofluorescence)
(Figure 2. IF analysis of GNB1 using anti-GNB1 antibody (AAA126938).GNB1 was detected in an immunocytochemical section of SiHa cells. Enzyme antigen retrieval was performed using IHC enzyme antigen retrieval reagent (AR0022) for 15 mins. The cells were blocked with 10% goat serum. And then incubated with 5 ug/mL mouse anti-GNB1 Antibody (AAA126938) overnight at 4 degree C. DyLight488 Conjugated Goat Anti-Mouse IgG was used as secondary antibody at 1:100 dilution and incubated for 30 minutes at 37 degree C. The section was counterstained with DAPI. Visualize using a fluorescence microscope and filter sets appropriate for the label used.)
GNB1, Monoclonal Antibody (Cat# AAA126938)
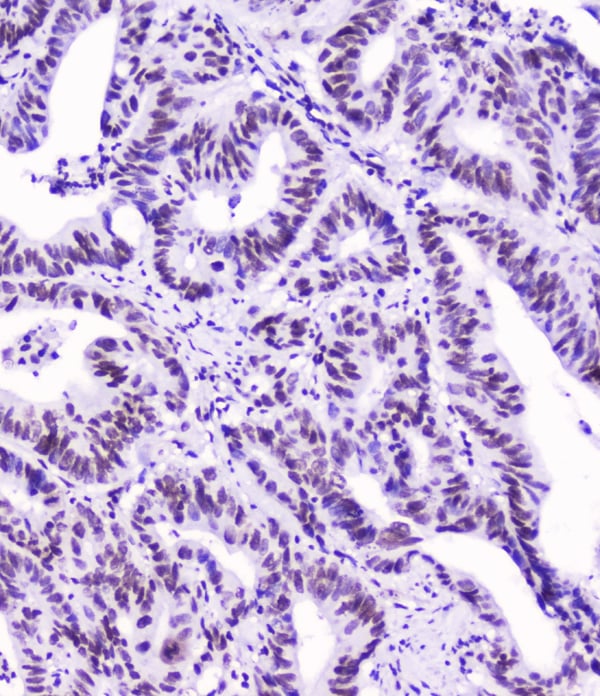
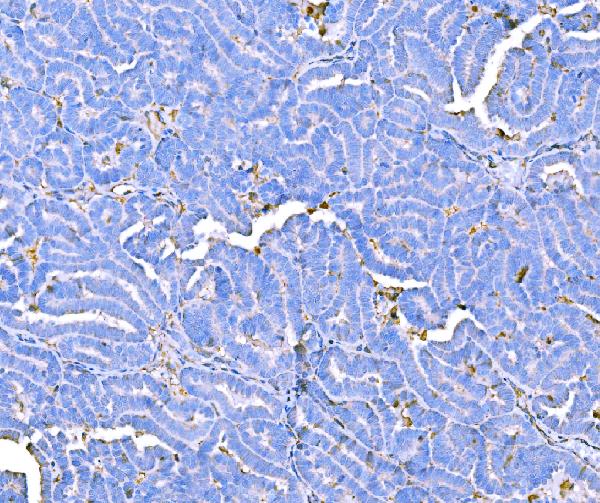 IHC (Immunohistochemistry)
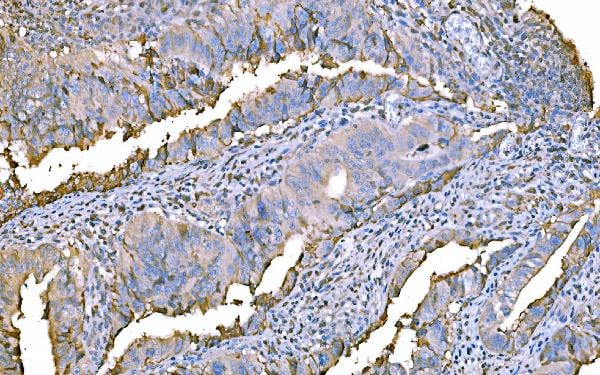
(Figure 4. IHC analysis of Prothrombin using anti-Prothrombin antibody (AAA126858).Prothrombin was detected in a paraffin-embedded section of human ovarian cancer tissue. Heat mediated antigen retrieval was performed in EDTA buffer (pH 8.0, epitope retrieval solution). The tissue section was blocked with 10% goat serum. The tissue section was then incubated with 2 ug/ml mouse anti-Prothrombin Antibody (AAA126858) overnight at 4 degree C. Biotinylated goat anti-mouse IgG was used as secondary antibody and incubated for 30 minutes at 37 degree C. The tissue section was developed using Strepavidin-Biotin-Complex (SABC) (#SA1021) with DAB as the chromogen.)
IHC (Immunohistochemistry)
(Figure 4. IHC analysis of Prothrombin using anti-Prothrombin antibody (AAA126858).Prothrombin was detected in a paraffin-embedded section of human ovarian cancer tissue. Heat mediated antigen retrieval was performed in EDTA buffer (pH 8.0, epitope retrieval solution). The tissue section was blocked with 10% goat serum. The tissue section was then incubated with 2 ug/ml mouse anti-Prothrombin Antibody (AAA126858) overnight at 4 degree C. Biotinylated goat anti-mouse IgG was used as secondary antibody and incubated for 30 minutes at 37 degree C. The tissue section was developed using Strepavidin-Biotin-Complex (SABC) (#SA1021) with DAB as the chromogen.)
Prothrombin, Monoclonal Antibody (Cat# AAA126858)
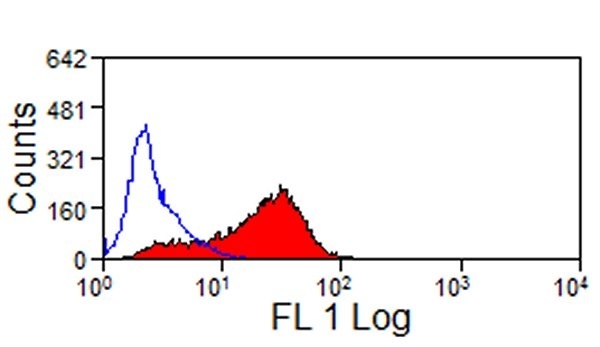
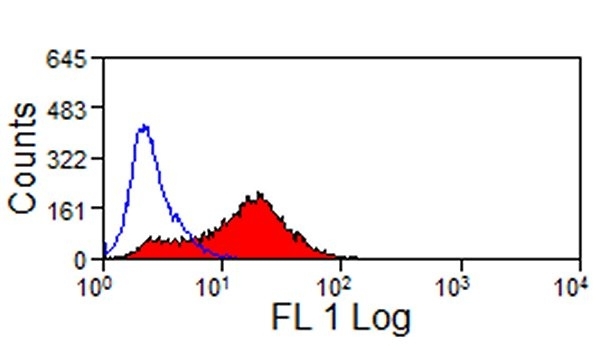
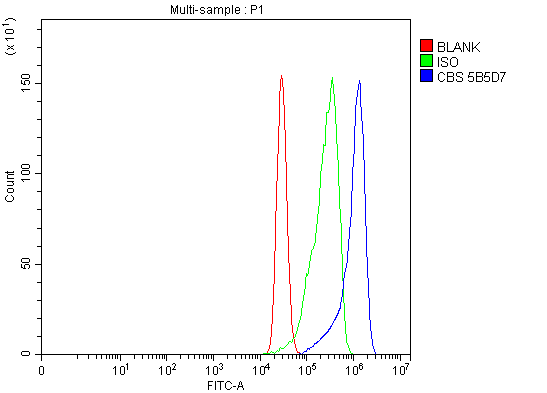 FCM/FACS (Flow Cytometry)
(Figure 2. Flow Cytometry analysis of MCF-7 cells using anti-CBS antibody (AAA126860).Overlay histogram showing MCF-7 cells stained with AAA126860 (Blue line). The cells were blocked with 10% normal goat serum. And then incubated with mouse anti-CBS Antibody (AAA126860, 1 ug/1x10^6 cells) for 30 min at 20 degree C. DyLight488 conjugated goat anti-mouse IgG was used as secondary antibody for 30 minutes at 20 degree C. Isotype control antibody (Green line) was mouse IgG (1 ug/1x10^6) used under the same conditions. Unlabelled sample (Red line) was also used as a control.)
FCM/FACS (Flow Cytometry)
(Figure 2. Flow Cytometry analysis of MCF-7 cells using anti-CBS antibody (AAA126860).Overlay histogram showing MCF-7 cells stained with AAA126860 (Blue line). The cells were blocked with 10% normal goat serum. And then incubated with mouse anti-CBS Antibody (AAA126860, 1 ug/1x10^6 cells) for 30 min at 20 degree C. DyLight488 conjugated goat anti-mouse IgG was used as secondary antibody for 30 minutes at 20 degree C. Isotype control antibody (Green line) was mouse IgG (1 ug/1x10^6) used under the same conditions. Unlabelled sample (Red line) was also used as a control.)
CBS, Monoclonal Antibody (Cat# AAA126860)

 FCM/FACS (Flow Cytometry)
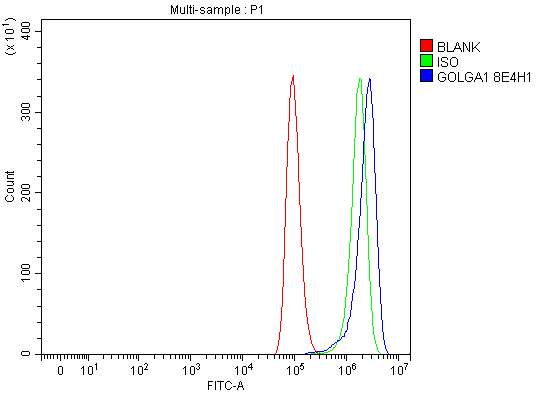
(Figure 3. Flow Cytometry analysis of A549 cells using anti-Golgin 97/GOLGA1 antibody (AAA126959).Overlay histogram showing A549 cells stained with AAA126959 (Blue line). The cells were blocked with 10% normal goat serum. And then incubated with mouse anti-Golgin 97/GOLGA1 Antibody (AAA126959, 1 ug/1x10^6 cells) for 30 min at 20 degree C. DyLight488 conjugated goat anti-mouse IgG was used as secondary antibody for 30 minutes at 20 degree C. Isotype control antibody (Green line) was mouse IgG (1 ug/1x10^6) used under the same conditions. Unlabelled sample (Red line) was also used as a control.)
FCM/FACS (Flow Cytometry)
(Figure 3. Flow Cytometry analysis of A549 cells using anti-Golgin 97/GOLGA1 antibody (AAA126959).Overlay histogram showing A549 cells stained with AAA126959 (Blue line). The cells were blocked with 10% normal goat serum. And then incubated with mouse anti-Golgin 97/GOLGA1 Antibody (AAA126959, 1 ug/1x10^6 cells) for 30 min at 20 degree C. DyLight488 conjugated goat anti-mouse IgG was used as secondary antibody for 30 minutes at 20 degree C. Isotype control antibody (Green line) was mouse IgG (1 ug/1x10^6) used under the same conditions. Unlabelled sample (Red line) was also used as a control.)
Golgin 97/GOLGA1, Monoclonal Antibody (Cat# AAA126959)
TSHR/LGR3, Monoclonal Antibody (Cat# AAA120167)
Protein A/G purified from cell culture supernatant

 Application Data
(Staining of JAM-C transfected CHO cells with Rat anti Mouse JAM-C:Biotin followed by Streptavidin:FITC)
Application Data
(Staining of JAM-C transfected CHO cells with Rat anti Mouse JAM-C:Biotin followed by Streptavidin:FITC)
JAM-C, Monoclonal Antibody (Cat# AAA50212)
SHP2/PTPN11, Monoclonal Antibody (Cat# AAA125128)

 WB (Western Blot)
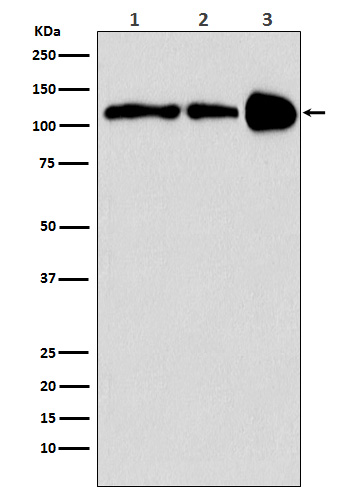
(Figure 3. Western blot analysis of SMC3 using anti-SMC3 antibody (M01930-1).Electrophoresis was performed on a 8% SDS-PAGE gel at 70V (Stacking gel)/90V (Resolving gel) for 2-3 hours. The sample well of each lane was loaded with 50ug of sample under reducing conditions.Lane 1: human Hela whole cell lysate,Lane 2: human A549 whole cell lysate,Lane 3: human MCF-7 whole cell lysate,Lane 4: human MDA-MB-453 whole cell lysate.After Electrophoresis, proteins were transferred to a Nitrocellulose membrane at 150mA for 50-90 minutes. Blocked the membrane with 5% Non-fat Milk/TBS for 1.5 hour at RT. The membrane was incubated with mouse anti-SMC3 antigen affinity purified monoclonal antibody at 0.5 ug/ml overnight at 4 degree C, then washed with TBS-0.1%Tween 3 times with 5 minutes each and probed with a goat anti-mouse IgG-HRP secondary antibody at a dilution of 1:10000 for 1.5 hour at RT. The signal is developed using an Enhanced Chemiluminescent detection (ECL) kit with Tanon 5200 system.)
WB (Western Blot)
(Figure 3. Western blot analysis of SMC3 using anti-SMC3 antibody (M01930-1).Electrophoresis was performed on a 8% SDS-PAGE gel at 70V (Stacking gel)/90V (Resolving gel) for 2-3 hours. The sample well of each lane was loaded with 50ug of sample under reducing conditions.Lane 1: human Hela whole cell lysate,Lane 2: human A549 whole cell lysate,Lane 3: human MCF-7 whole cell lysate,Lane 4: human MDA-MB-453 whole cell lysate.After Electrophoresis, proteins were transferred to a Nitrocellulose membrane at 150mA for 50-90 minutes. Blocked the membrane with 5% Non-fat Milk/TBS for 1.5 hour at RT. The membrane was incubated with mouse anti-SMC3 antigen affinity purified monoclonal antibody at 0.5 ug/ml overnight at 4 degree C, then washed with TBS-0.1%Tween 3 times with 5 minutes each and probed with a goat anti-mouse IgG-HRP secondary antibody at a dilution of 1:10000 for 1.5 hour at RT. The signal is developed using an Enhanced Chemiluminescent detection (ECL) kit with Tanon 5200 system.)
SMC3, Monoclonal Antibody (Cat# AAA125143)
 WB (Western Blot)
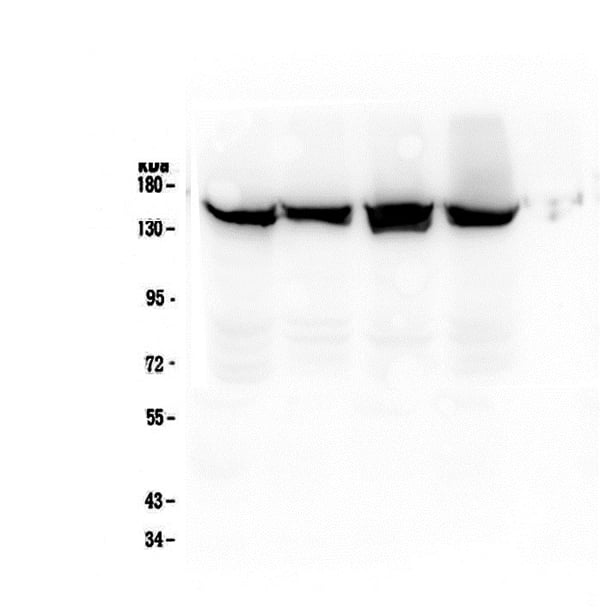
(Western Blot analysis of PGC1 beta expression in:(1) Hela cell lysate;(2) Mouse spleen lysate(3) Rat spleen lysate.)
WB (Western Blot)
(Western Blot analysis of PGC1 beta expression in:(1) Hela cell lysate;(2) Mouse spleen lysate(3) Rat spleen lysate.)
PGC1 beta, Monoclonal Antibody (Cat# AAA125157)
 WB (Western Blot)
Mitofusin 1, Monoclonal Antibody (Cat# AAA125503)
NiV G protein/Glycoprotein G, Monoclonal Antibody (Cat# AAA120691)
Protein A or G purified from cell culture supernatant.
 SDS-PAGE
(SDS-PAGE Analysis Purified OLIG2 Recombinant Rabbit Monoclonal Antibody (OLIG2/7074R). Confirmation of Purity and Integrity of Antibody.)
SDS-PAGE
(SDS-PAGE Analysis Purified OLIG2 Recombinant Rabbit Monoclonal Antibody (OLIG2/7074R). Confirmation of Purity and Integrity of Antibody.)
OLIG2, Monoclonal Antibody (Cat# AAA215511)
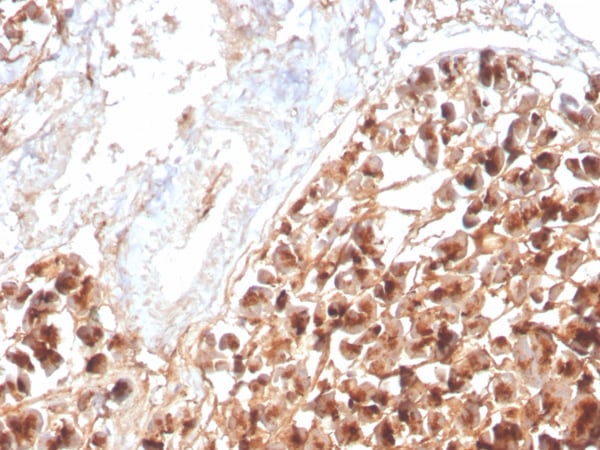
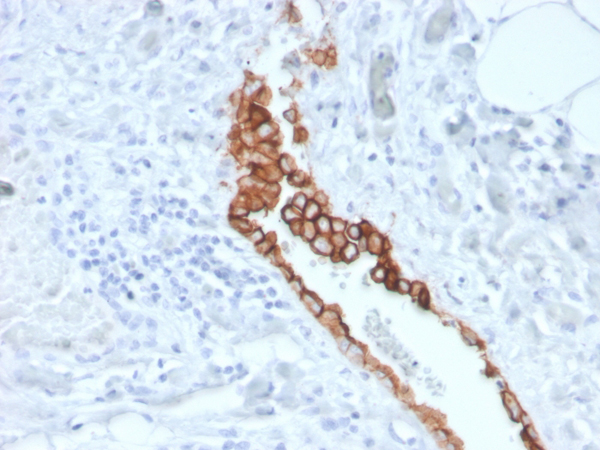 IHC (Immunohistochemistry)
(Formalin-fixed, paraffin-embedded human mesothelioma stained with Mesothelin Mouse Monoclonal Antibody (MSLN/3387).)
IHC (Immunohistochemistry)
(Formalin-fixed, paraffin-embedded human mesothelioma stained with Mesothelin Mouse Monoclonal Antibody (MSLN/3387).)
Mesothelin, Monoclonal Antibody (Cat# AAA215513)
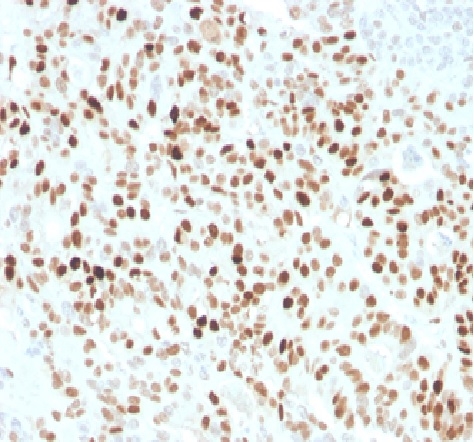 IHC (Immunohistochemistry)
(Formalin fixed paraffin embedded human colon carcinoma stained with p21 Rabbit Recombinant Monoclonal Antibody (CIP1/4377R).)
IHC (Immunohistochemistry)
(Formalin fixed paraffin embedded human colon carcinoma stained with p21 Rabbit Recombinant Monoclonal Antibody (CIP1/4377R).)
p21WAF1, Monoclonal Antibody (Cat# AAA215514)
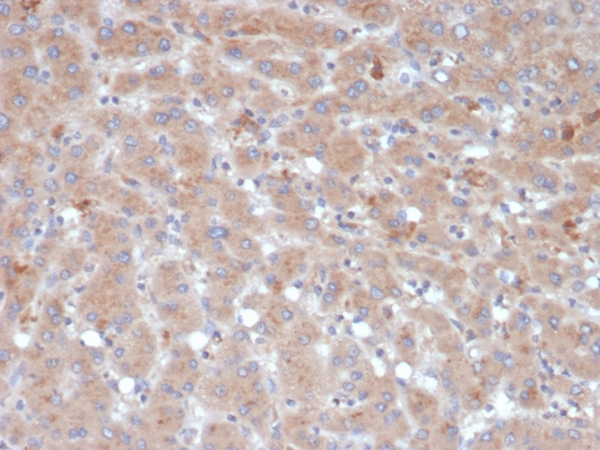 IHC (Immunohistochemistry)
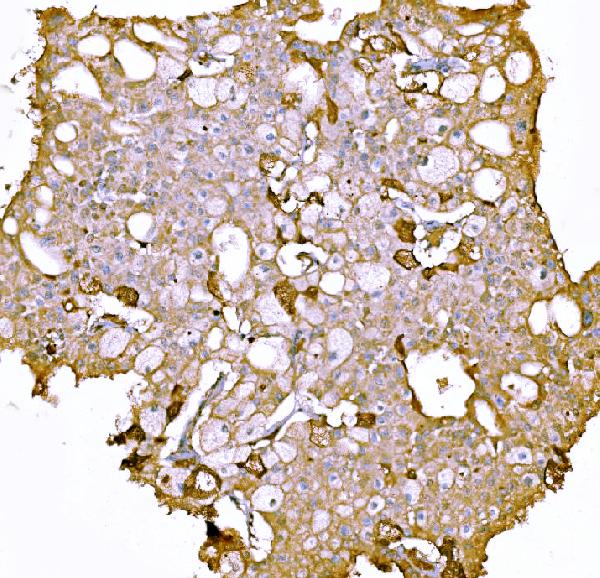
(Formalin-fixed, paraffin-embedded human liver stained with Alpha-1-Antichymotrypsin Mouse Monoclonal Antibody (SERPINA3/4189).)
IHC (Immunohistochemistry)
(Formalin-fixed, paraffin-embedded human liver stained with Alpha-1-Antichymotrypsin Mouse Monoclonal Antibody (SERPINA3/4189).)
Alpha-1-Antichymotrypsin (SERPINA3), Monoclonal Antibody (Cat# AAA215566)
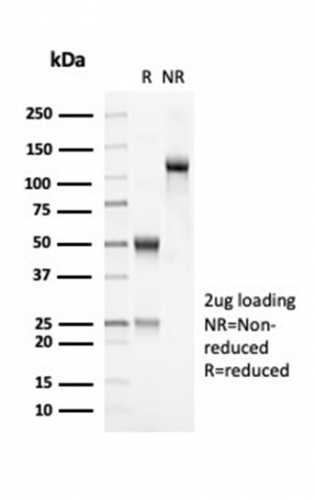
 SDS-PAGE
(SDS-PAGE Analysis Purified EPX Recombinant Mouse Monoclonal Antibody (rEPO104). Confirmation of Purity and Integrity of Antibody.)
SDS-PAGE
(SDS-PAGE Analysis Purified EPX Recombinant Mouse Monoclonal Antibody (rEPO104). Confirmation of Purity and Integrity of Antibody.)
Eosinophil Peroxidase (EPX), Monoclonal Antibody (Cat# AAA215429)

 Application Data
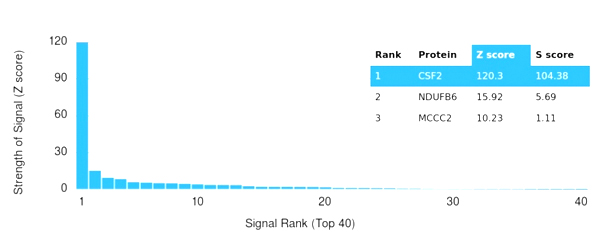
(Analysis of Protein Array containing more than 19,000 full-length human proteins using GM-CSF Mouse Monoclonal Antibody (CSF2/3403). Z- and S- Score: The Z-score represents the strength of a signal that a monoclonal antibody (MAb) (in combination with a fluorescently-tagged anti-IgG secondary antibody) produces when binding to a particular protein on the HuProtTM array. Z-scores are described in units of standard deviations (SD's) above the mean value of all signals generated on that array. If targets on HuProtTM are arranged in descending order of the Z-score, the S-score is the difference (also in units of SD's) between the Z-score. S-score therefore represents the relative target specificity of a MAb to its intended target. A MAb is considered to specific to its intended target, if the MAb has an S-score of at least 2.5. For example, if a MAb binds to protein X with a Z-score of 43 and to protein Y with a Z-score of 14, then the S-score for the binding of that MAb to protein X is equal to 29.)
Application Data
(Analysis of Protein Array containing more than 19,000 full-length human proteins using GM-CSF Mouse Monoclonal Antibody (CSF2/3403). Z- and S- Score: The Z-score represents the strength of a signal that a monoclonal antibody (MAb) (in combination with a fluorescently-tagged anti-IgG secondary antibody) produces when binding to a particular protein on the HuProtTM array. Z-scores are described in units of standard deviations (SD's) above the mean value of all signals generated on that array. If targets on HuProtTM are arranged in descending order of the Z-score, the S-score is the difference (also in units of SD's) between the Z-score. S-score therefore represents the relative target specificity of a MAb to its intended target. A MAb is considered to specific to its intended target, if the MAb has an S-score of at least 2.5. For example, if a MAb binds to protein X with a Z-score of 43 and to protein Y with a Z-score of 14, then the S-score for the binding of that MAb to protein X is equal to 29.)
GM-CSF, Monoclonal Antibody (Cat# AAA215440)
What are Monoclonal Antibodies?
Monoclonal antibodies are specialized laboratory-produced proteins developed for binding to specific biological antigens or other molecular targets. Since they come from a single cell (or clone), they are especially consistent and accurate in the data they are involved in producing.
This type of antibody material has been shown to be a powerful tool in finding and subsequently destroying harmful cells in an organism, such as those found in cancers or various autoimmune diseases. This makes them excellent aids in medical testing and research, which is why they are so widely used.
AAA Biotech offers a comprehensive range of high-quality monoclonal antibodies that perform effectively in various laboratory tests, including (amongst others) ELISA, western blotting, immunohistochemistry, and flow cytometry. All of the products in our catalog are thoroughly quality tested to make sure that they are reliable and will consistently perform well in your research.
What Are The Uses of Monoclonal Antibodies
Monoclonal antibodies are used in many lab tests, including (amongst others) ELISA, western blotting, immunohistochemistry, and flow cytometry.
ELISA is a test that helps detect a specific substance/analyte in a sample. It uses antibodies (often monoclonal) bound to a solid surface (such as the well of a microplate) to “capture” the substance/analyte in the sample and immobilize it so that the detection antibody component can then bind to it and produce a signal, which can then be measured.
Western blotting identifies specific proteins in a sample. The sample is first separated on a gel, and then antibodies are applied that will typically bind to the target, which will all be localized to a single band in a lane.
Immunohistochemistry helps locate specific proteins in cells or tissue samples using antibodies.
Flow cytometry looks at and sorts cells. It uses antibodies that are conjugated to reporter molecules called “fluorophores”, which, under special lights, emit light themselves, which can then be measured by a detector instrument.
How Monoclonal Antibodies Are Used as Medicine?
Please note that all of the products listed in AAA Biotech’s also known as AAA Bio or AAABio catalog are strictly for research-use only (RUO).
Monoclonal antibodies can also be used as therapeutic/medical treatments, particularly in the context of cancers. They are designed to find and bind to specific cells or proteins, helping the immune system recognize and attack the cancer. These treatments work in different ways, such as:
- Radioimmunotherapy attaches a small amount of radioactive molecule to the antibody, so it delivers the radiation directly to the cancer cells that the antibody is specifically binding to.
- Antibody-directed enzyme prodrug therapy uses antibodies that are specifically bound to special enzymes. These enzymes activate a harmless drug in the body and turn it into a cancer-killing drug only near the cancer cells—this helps avoid harming healthy cells.
- Immunoliposomes are tiny “bubbles” filled with medicine/drug and coated with antibodies. They carry the drug straight to the cancer cells.
Why Buy Monoclonal Antibodies From Us?
At AAA Biotech, we provide high-performance monoclonal antibodies designed to support a wide range of research needs.
1. Validated for Versatile Applications
The antibodies in our catalog are extensively validated and compatible with multiple techniques, including (but not limited to) ELISA, flow cytometry (FC), immunocytochemistry (ICC), immunofluorescence (IF), immunohistochemistry (IHC), immunoprecipitation (IP), and western blotting (WB).
2. Wide Selection & Specialized Options
We offer antibodies for common and rare species, that are available in various conjugated forms, and also in recombinant formats. Essentially, there is almost anything one might need to meet their experimental model’s requirements.
3. High-Quality Proteins
Our proteins meet high purity standards—90% or more as confirmed by SDS-PAGE. Many are available with tags like His, Flag, GST, or MBP, and we also supply native and biologically active proteins for functional studies.
Frequently Asked Questions
1. Are your monoclonal antibodies validated for specific applications?
Yes, our antibodies are tested and validated for use in methods such as ELISA, western blot, IHC, flow cytometry, and more. Refer to specific product pages or datasheets for individual product information.
2. How do I choose the right monoclonal antibody for my application?
Review the product details directly for application validation, species reactivity, and target information. You may also contact our support team at any time for help.
3. How quickly can I receive my order?
Most orders are processed and shipped within 1–3 business days, depending on product availability and your shipping location.