Filters
▼Clonality
▼Type
▼Reactivity
▼Gene Name
▼Isotype
▼Host
▼Application
▼Clone
▼Monoclonal Antibodies
Get accurate results in your research with our Monoclonal Antibodies, which are specially made to target exactly what you require for your research, and will produce consistent, reliable performance in lab tests.
Viewing 4700-4750 of 27597 product results
 FCM/FACS (Flow Cytometry)
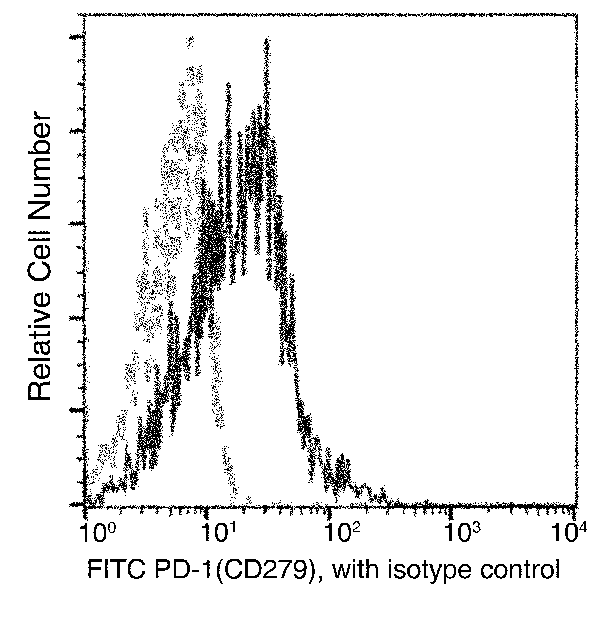
(Flow cytometric analysis of Human PD-1 (CD279) expression on PHA-activated human whole blood Lymphocytes. Cells were stained with FITC-conjugated anti-Human PD-1 (CD279). The fluorescence histograms were derived from gated events with the forward and side light-scatter characteristics of viable Lymphocytes.Flow Cytometry was performed on a BD FACSCalibur flow cytometry system.)
FCM/FACS (Flow Cytometry)
(Flow cytometric analysis of Human PD-1 (CD279) expression on PHA-activated human whole blood Lymphocytes. Cells were stained with FITC-conjugated anti-Human PD-1 (CD279). The fluorescence histograms were derived from gated events with the forward and side light-scatter characteristics of viable Lymphocytes.Flow Cytometry was performed on a BD FACSCalibur flow cytometry system.)
PD-1, Monoclonal Antibody (Cat# AAA254880)
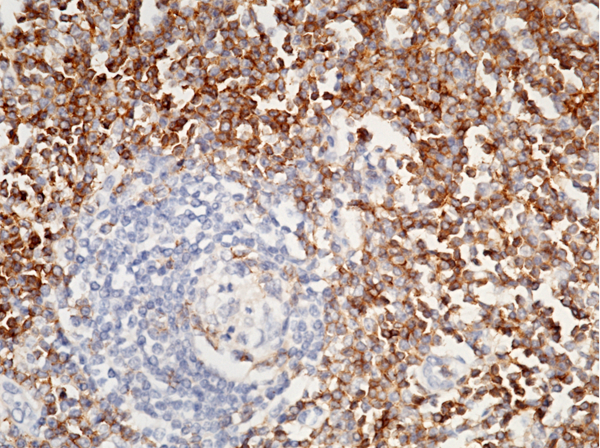
 IHC (Immunohistochemisry)
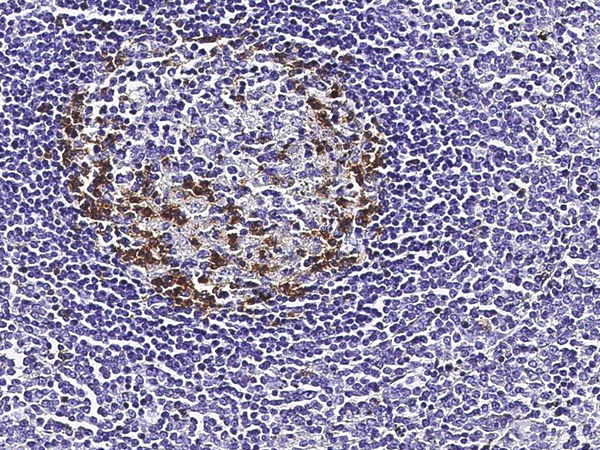
(Immunochemical staining of human PD1 in human lymphnode with rabbit monoclonal antibody (1:200,formalin-fixed paraffin embedded sections).)
IHC (Immunohistochemisry)
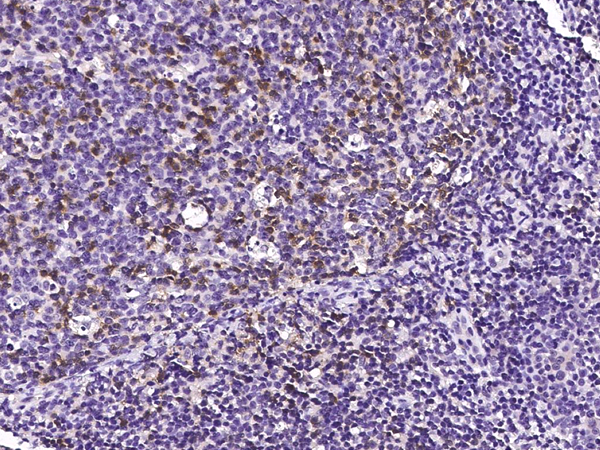
(Immunochemical staining of human PD1 in human lymphnode with rabbit monoclonal antibody (1:200,formalin-fixed paraffin embedded sections).)
PD-1, Monoclonal Antibody (Cat# AAA254882)
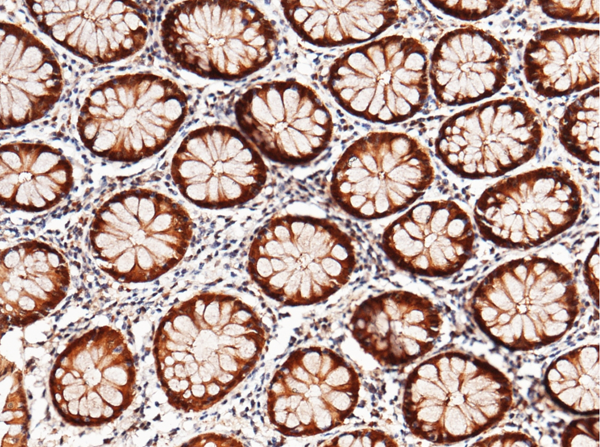
 IHC (Immunohiostchemistry)
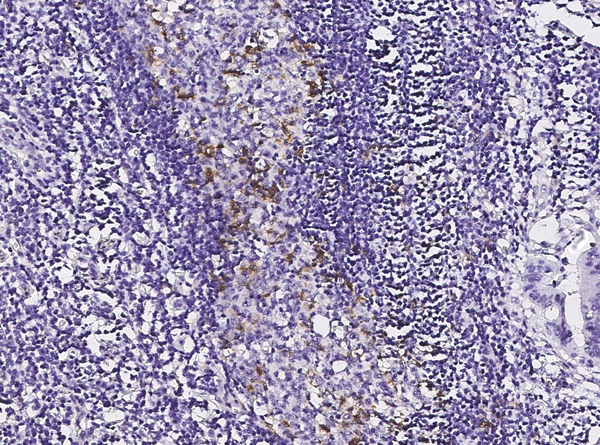
(Immunochemical staining of human TXN in human appendix with rabbit monoclonal antibody (1:200, formalin-fixed paraffin embedded sections). Positive staining was localized to intestinal gland.)
IHC (Immunohiostchemistry)
(Immunochemical staining of human TXN in human appendix with rabbit monoclonal antibody (1:200, formalin-fixed paraffin embedded sections). Positive staining was localized to intestinal gland.)
Thioredoxin/TRX, Monoclonal Antibody (Cat# AAA254887)
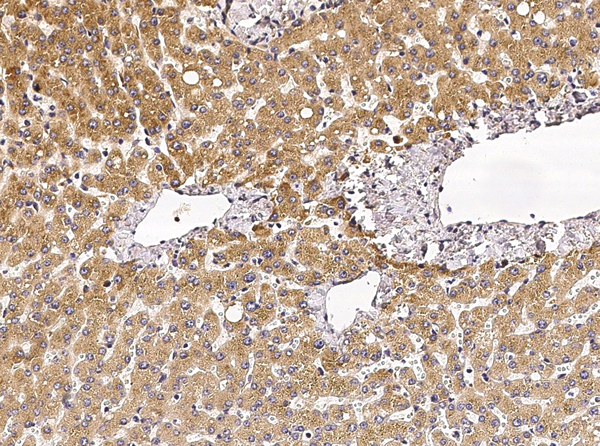
 IHC (Immunohistochemisry)
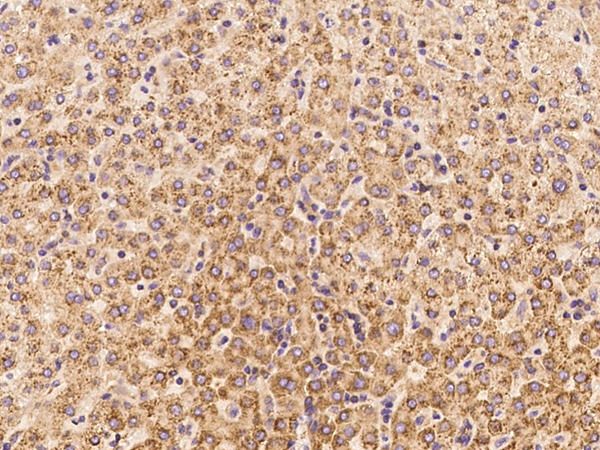
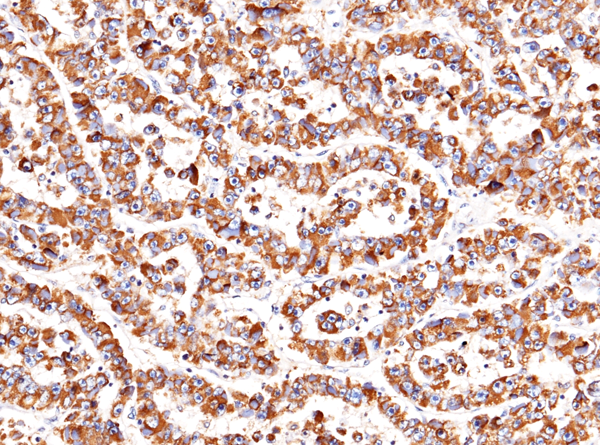
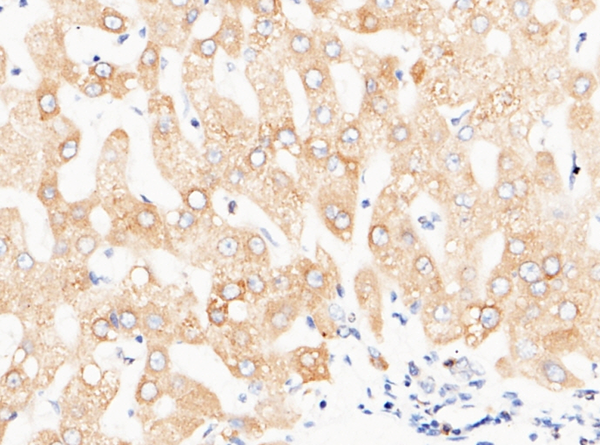
(Immunochemical staining of human IL6 in human liver with mouse monoclonal antibody at 1:60 dilution, formalin-fixed paraffin embedded sections.)
IHC (Immunohistochemisry)
(Immunochemical staining of human IL6 in human liver with mouse monoclonal antibody at 1:60 dilution, formalin-fixed paraffin embedded sections.)
IL-6, Monoclonal Antibody (Cat# AAA254896)
 FCM/FACS (Flow Cytometry)
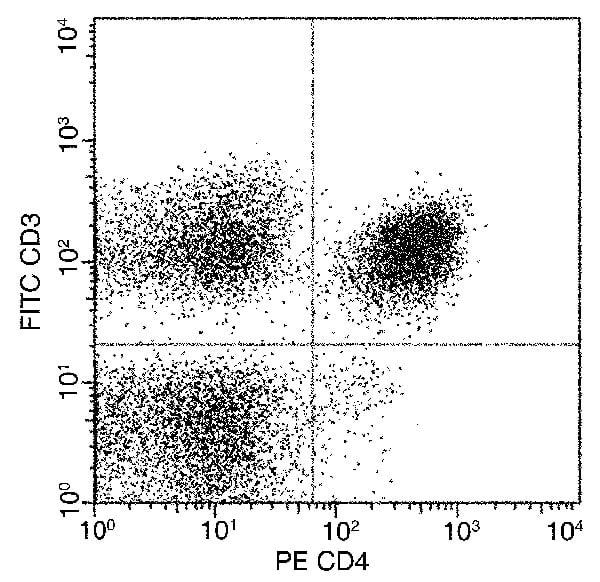
(Flow cytometric analysis of Human CD4 expression on human peripheral blood lymphocytes. Cells were stained with PE-conjugated anti-Human CD4 and FITC conjugated anti-Human CD3 (BD Pharmingen'). The dot plots were derived from events with the forward and side light-scatter characteristics of viable lymphocytes.Flow Cytometry was perfomed on a BD FACSCalibur flow cytometry system.)
FCM/FACS (Flow Cytometry)
(Flow cytometric analysis of Human CD4 expression on human peripheral blood lymphocytes. Cells were stained with PE-conjugated anti-Human CD4 and FITC conjugated anti-Human CD3 (BD Pharmingen'). The dot plots were derived from events with the forward and side light-scatter characteristics of viable lymphocytes.Flow Cytometry was perfomed on a BD FACSCalibur flow cytometry system.)
CD4, Monoclonal Antibody (Cat# AAA254899)
 IHC (Immunohistochemisry)
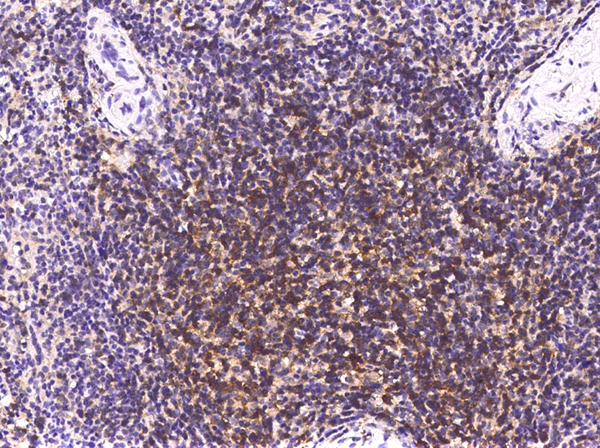
(Immunochemical staining of human CD4 in human lymphoid node with mouse monoclonal antibody (1:60, formalin-fixed paraffin embedded sections). Positive staining was localized to membrane of T cells.)
IHC (Immunohistochemisry)
(Immunochemical staining of human CD4 in human lymphoid node with mouse monoclonal antibody (1:60, formalin-fixed paraffin embedded sections). Positive staining was localized to membrane of T cells.)
CD4, Monoclonal Antibody (Cat# AAA254900)
 IHC (Immunohistochemisry)
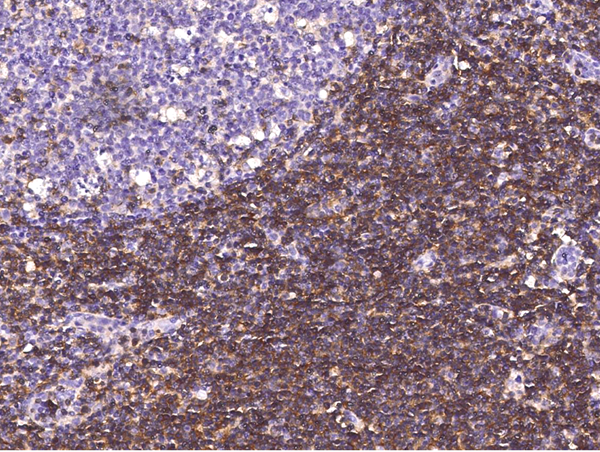
(Immunochemical staining of human CD4 in human lymph node with mouse monoclonal antibody (1:200, formalin-fixed paraffin embedded sections).)
IHC (Immunohistochemisry)
(Immunochemical staining of human CD4 in human lymph node with mouse monoclonal antibody (1:200, formalin-fixed paraffin embedded sections).)
CD4, Monoclonal Antibody (Cat# AAA254901)
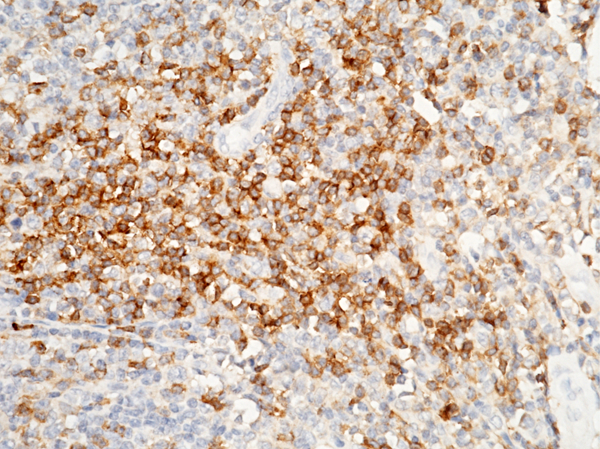
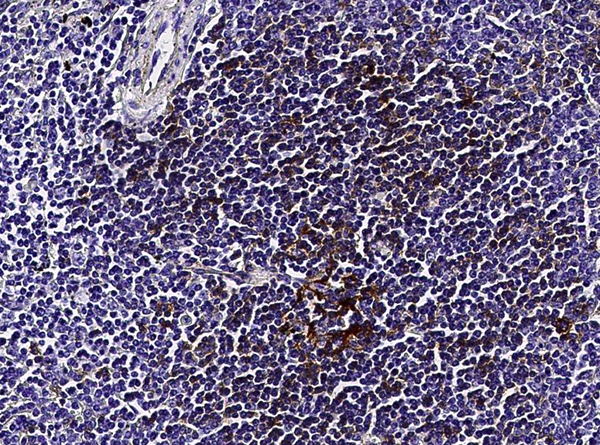
 IHC (Immunohistochemisry)
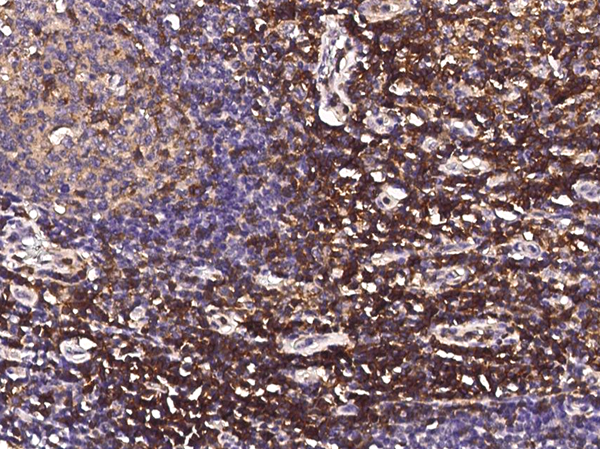
(Immunochemical staining CD4 in cynomolgus spleen with rabbit monoclonal antibody at 1:500 dilution, formalin-fixed paraffin embedded sections.)
IHC (Immunohistochemisry)
(Immunochemical staining CD4 in cynomolgus spleen with rabbit monoclonal antibody at 1:500 dilution, formalin-fixed paraffin embedded sections.)
CD4, Monoclonal Antibody (Cat# AAA254902)
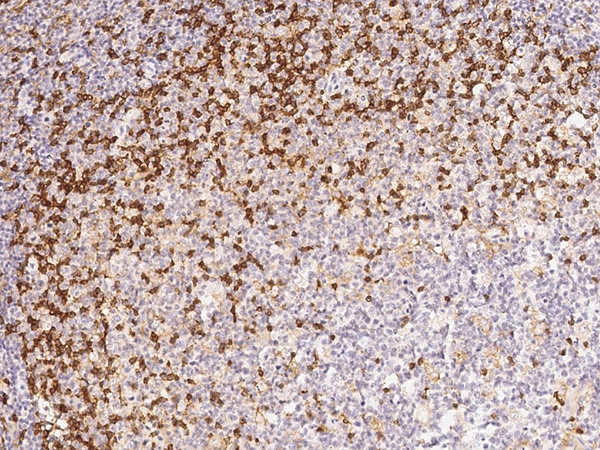
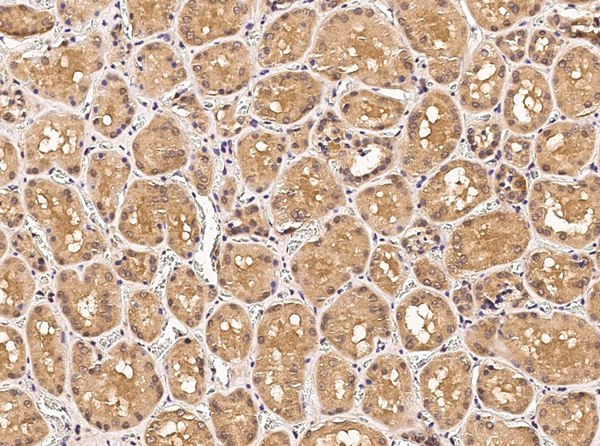 IHC (Immunohiostchemistry)
(Immunochemical staining of human TNFRSF10D in human kidney with mouse monoclonal antibody (1:100, formalin-fixed paraffin embedded sections).)
IHC (Immunohiostchemistry)
(Immunochemical staining of human TNFRSF10D in human kidney with mouse monoclonal antibody (1:100, formalin-fixed paraffin embedded sections).)
DcR2/TRAIL R4, Monoclonal Antibody (Cat# AAA254906)
MMP-8, Monoclonal Antibody (Cat# AAA254763)
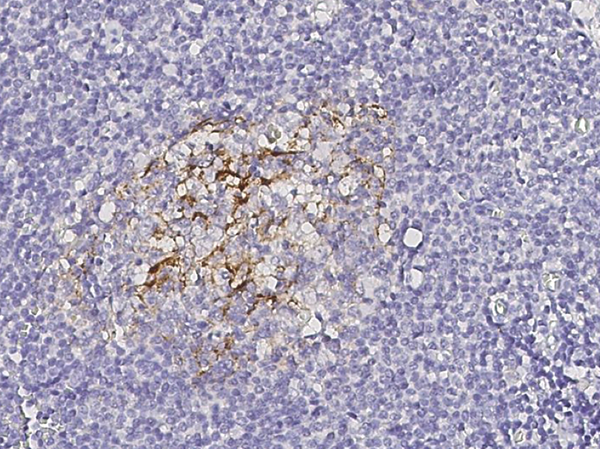
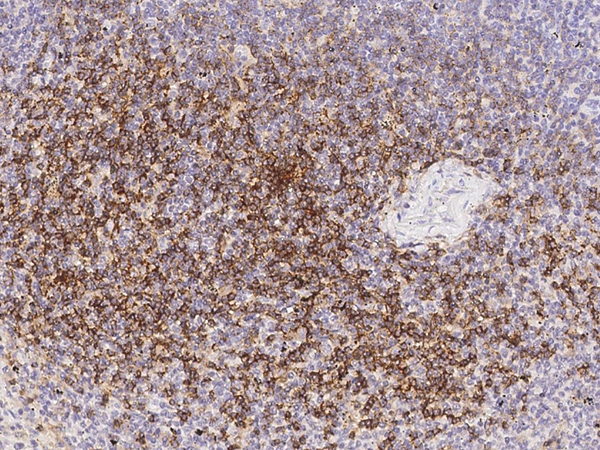
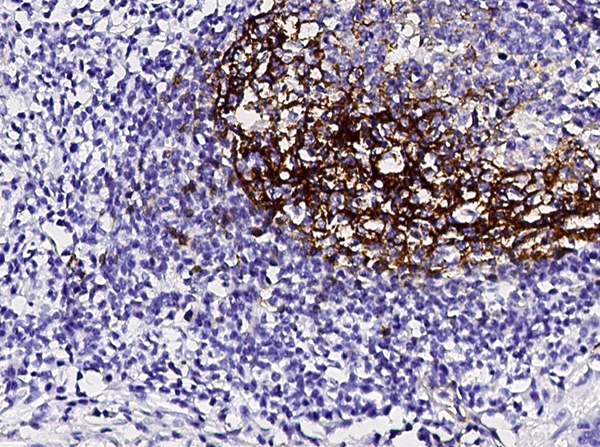
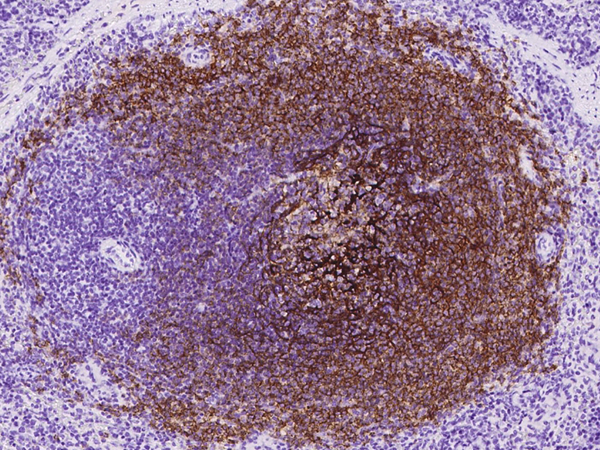
 IHC (Immunohiostchemistry)
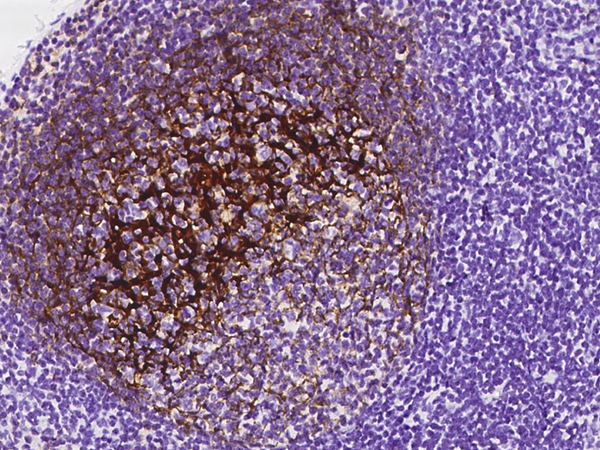
(Immunochemical staining of human CD23 in human tonsil with mouse monoclonal antibody (1:30, formalin-fixed paraffin embedded sections).)
IHC (Immunohiostchemistry)
(Immunochemical staining of human CD23 in human tonsil with mouse monoclonal antibody (1:30, formalin-fixed paraffin embedded sections).)
CD23, Monoclonal Antibody (Cat# AAA254770)
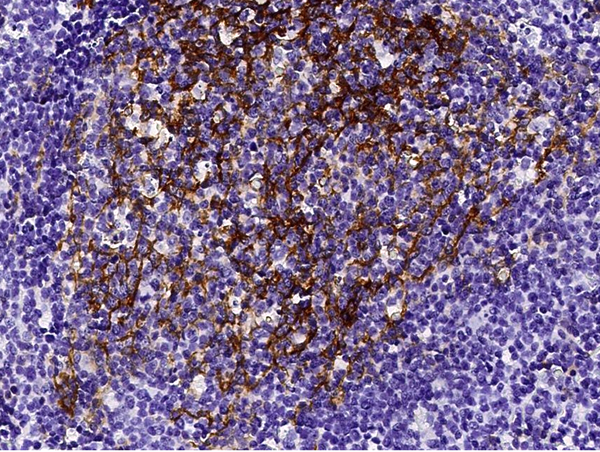
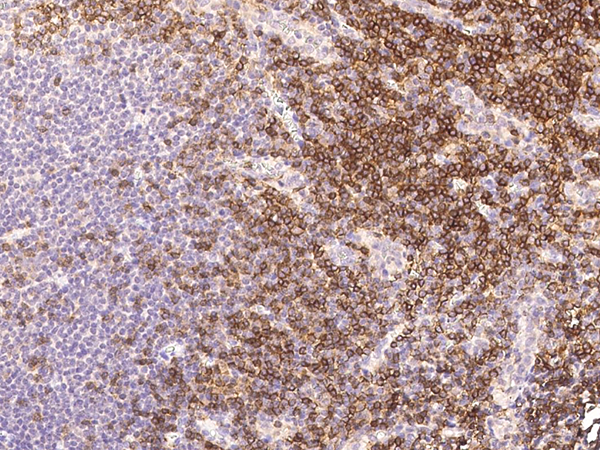
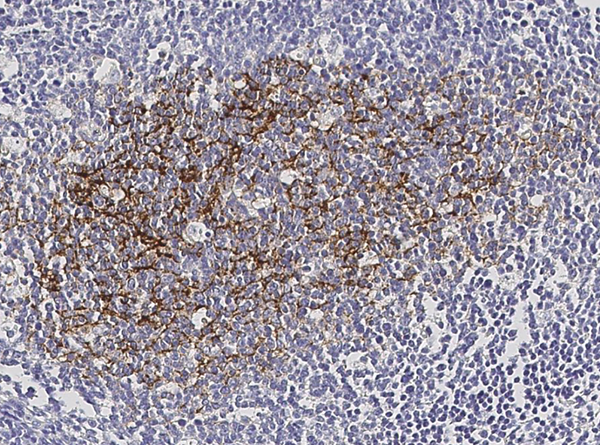
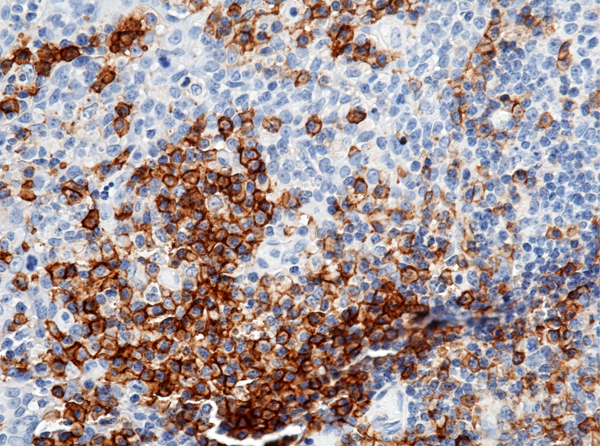
 IHC (Immunohistochemisry)
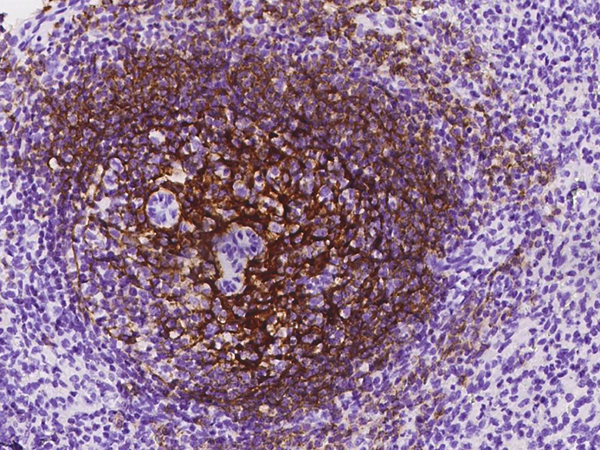
(Immunochemical staining of human CD23 in human lymph node with rabbit monoclonal antibody (1:200, formalin-fixed paraffin embedded sections).)
IHC (Immunohistochemisry)
(Immunochemical staining of human CD23 in human lymph node with rabbit monoclonal antibody (1:200, formalin-fixed paraffin embedded sections).)
CD23, Monoclonal Antibody (Cat# AAA254771)
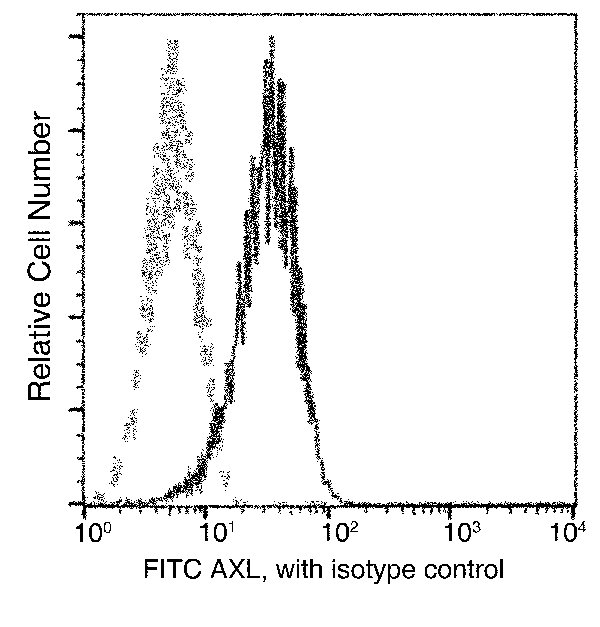 FCM/FACS (Flow Cytometry)
(Flow cytometric analysis of Human AXL expression on DU145 cells. Cells were stained with FITC-conjugated anti-Human AXL. The fluorescence histograms were derived from gated events with the forward and side light-scatter characteristics of intact cells.Flow cytometry was performed on a BD FACSCalibur flow cytometry system.)
FCM/FACS (Flow Cytometry)
(Flow cytometric analysis of Human AXL expression on DU145 cells. Cells were stained with FITC-conjugated anti-Human AXL. The fluorescence histograms were derived from gated events with the forward and side light-scatter characteristics of intact cells.Flow cytometry was performed on a BD FACSCalibur flow cytometry system.)
AXL, Monoclonal Antibody (Cat# AAA254789)

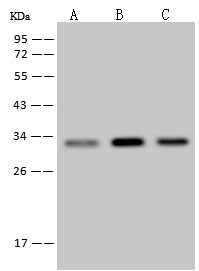
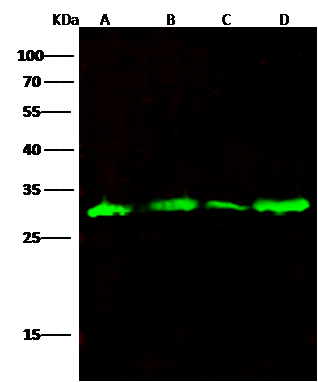
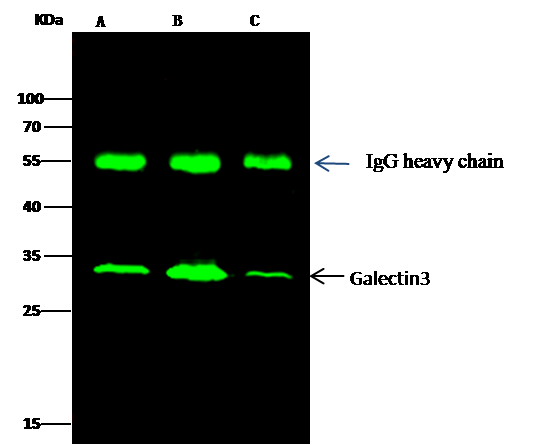
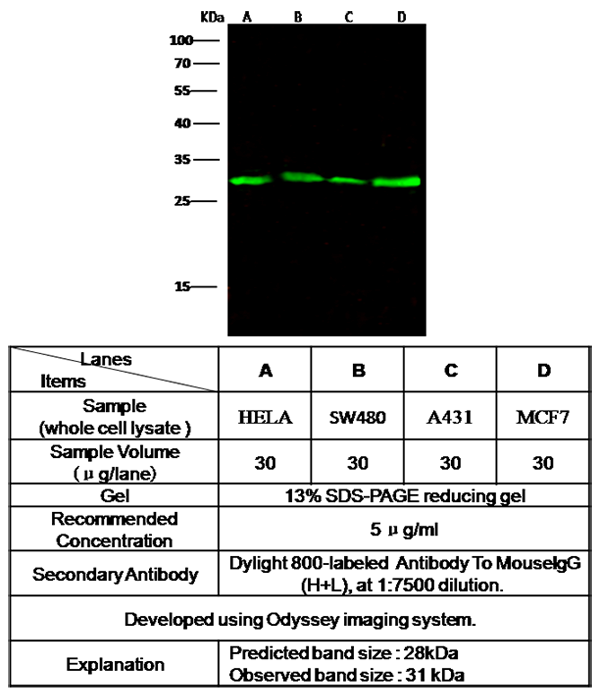 WB (Western Blot)
(Anti-Galectin3 mouse monoclonal antibody at 1:500 dilutionLane A: Hela Whole Cell LysateLane B: SW480 Whole Cell LysateLane C: A431 Whole Cell LysateLane D: MCF7 Whole Cell LysateLysates/proteins at 30 ug per lane.SecondaryGoat Anti-Mouse IgG H&L (Dylight800) at 1/15000 dilution.Developed using the Odyssey technique.Performed under reducing conditions.Predicted band size:28 kDaObserved band size:31 kDa)
WB (Western Blot)
(Anti-Galectin3 mouse monoclonal antibody at 1:500 dilutionLane A: Hela Whole Cell LysateLane B: SW480 Whole Cell LysateLane C: A431 Whole Cell LysateLane D: MCF7 Whole Cell LysateLysates/proteins at 30 ug per lane.SecondaryGoat Anti-Mouse IgG H&L (Dylight800) at 1/15000 dilution.Developed using the Odyssey technique.Performed under reducing conditions.Predicted band size:28 kDaObserved band size:31 kDa)
Galectin 3/LGALS3, Monoclonal Antibody (Cat# AAA254795)
 IP (Immunoprecipitation)
(NKX3-1 was immunoprecipitated using:Lane A:0.5 mg mouse pancreas Whole Cell Lysate4 uL anti-NKX3-1 rabbit polyclonal antibody and 60 ug of Immunomagnetic beads Protein A/G.Primary antibody:Anti-NKX3-1 rabbit polyclonal antibody,at 1:100 dilutionSecondary antibody:Goat Anti-Rabbit IgG (H+L)/HRP at 1/10000 dilutionDeveloped using the ECL technique.Performed under reducing conditions.Predicted band size: 27 kDaObserved band size :30 kDa)
IP (Immunoprecipitation)
(NKX3-1 was immunoprecipitated using:Lane A:0.5 mg mouse pancreas Whole Cell Lysate4 uL anti-NKX3-1 rabbit polyclonal antibody and 60 ug of Immunomagnetic beads Protein A/G.Primary antibody:Anti-NKX3-1 rabbit polyclonal antibody,at 1:100 dilutionSecondary antibody:Goat Anti-Rabbit IgG (H+L)/HRP at 1/10000 dilutionDeveloped using the ECL technique.Performed under reducing conditions.Predicted band size: 27 kDaObserved band size :30 kDa)
Galectin 3/LGALS3, Monoclonal Antibody (Cat# AAA254796)
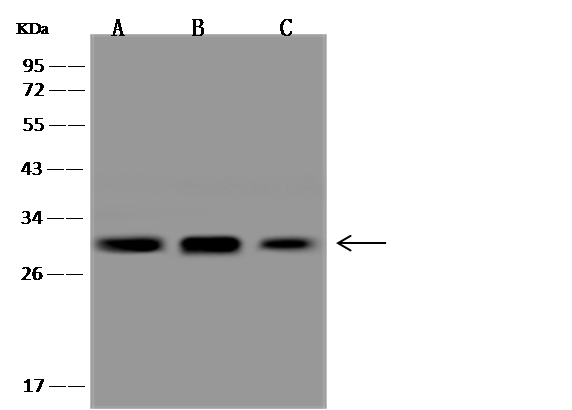
 IP (Immunoprecipitation)
(Galectin3 was immunoprecipitated using:Lane A:0.5 mg Hela Whole Cell LysateLane B:0.5 mg MCF-7 Whole Cell LysateLane C:0.5 mg A431 Whole Cell Lysate2 uL anti-Galectin3 rabbit monoclonal antibody and 15 ul of 50 % Protein G agarose.Primary antibody:Anti-Galectin3 rabbit monoclonal antibody,at 1:500 dilutionSecondary antibody:Dylight 800-labeled antibody to rabbit IgG (H+L), at 1:5000 dilutionDeveloped using the odssey technique.Performed under reducing conditions.Predicted band size: 30 kDaObserved band size: 30 kDa)
IP (Immunoprecipitation)
(Galectin3 was immunoprecipitated using:Lane A:0.5 mg Hela Whole Cell LysateLane B:0.5 mg MCF-7 Whole Cell LysateLane C:0.5 mg A431 Whole Cell Lysate2 uL anti-Galectin3 rabbit monoclonal antibody and 15 ul of 50 % Protein G agarose.Primary antibody:Anti-Galectin3 rabbit monoclonal antibody,at 1:500 dilutionSecondary antibody:Dylight 800-labeled antibody to rabbit IgG (H+L), at 1:5000 dilutionDeveloped using the odssey technique.Performed under reducing conditions.Predicted band size: 30 kDaObserved band size: 30 kDa)
Galectin 3/LGALS3, Monoclonal Antibody (Cat# AAA254797)
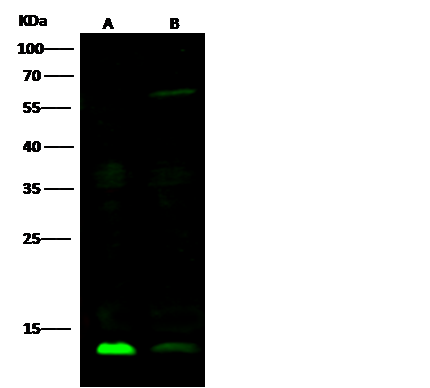
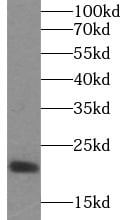
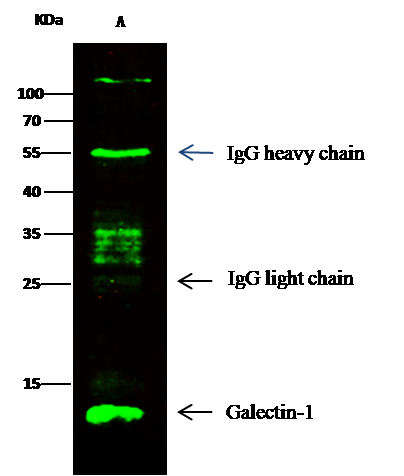 IP (Immunoprecipitation)
(Galectin1 was immunoprecipitated using:Lane A:0.5 mg Hela Whole Cell Lysate0.5 uL anti-Galectin1 mouse monoclonal antibody and 15 ul of 50 % Protein G agarose.Primary antibody:Anti-Galectin1 mouse monoclonal antibody,at 1:250 dilutionSecondary antibody:Dylight 800-labeled antibody to Mouse IgG (H+L), at 1:7500 dilutionDeveloped using the odssey technique.Performed under reducing conditions.Predicted band size: 15 kDaObserved band size: 15 kDa)
IP (Immunoprecipitation)
(Galectin1 was immunoprecipitated using:Lane A:0.5 mg Hela Whole Cell Lysate0.5 uL anti-Galectin1 mouse monoclonal antibody and 15 ul of 50 % Protein G agarose.Primary antibody:Anti-Galectin1 mouse monoclonal antibody,at 1:250 dilutionSecondary antibody:Dylight 800-labeled antibody to Mouse IgG (H+L), at 1:7500 dilutionDeveloped using the odssey technique.Performed under reducing conditions.Predicted band size: 15 kDaObserved band size: 15 kDa)
Galectin-1, Monoclonal Antibody (Cat# AAA254801)
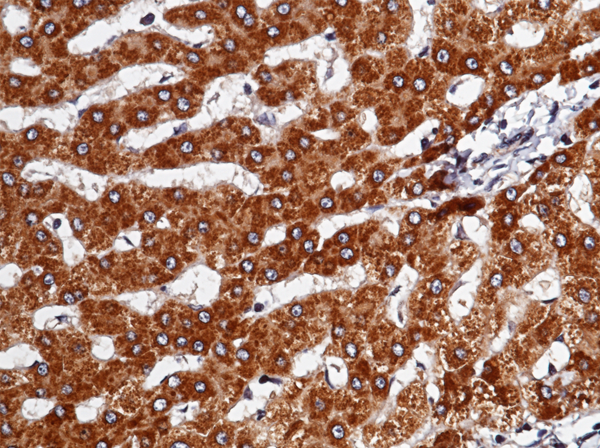
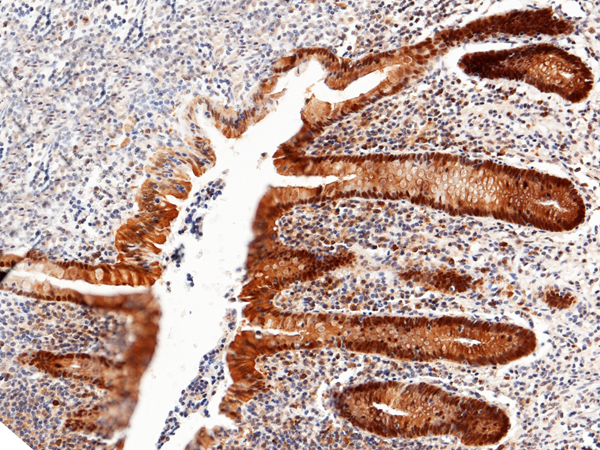
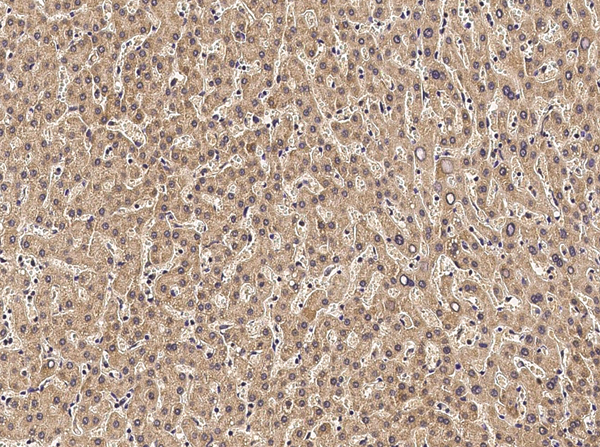
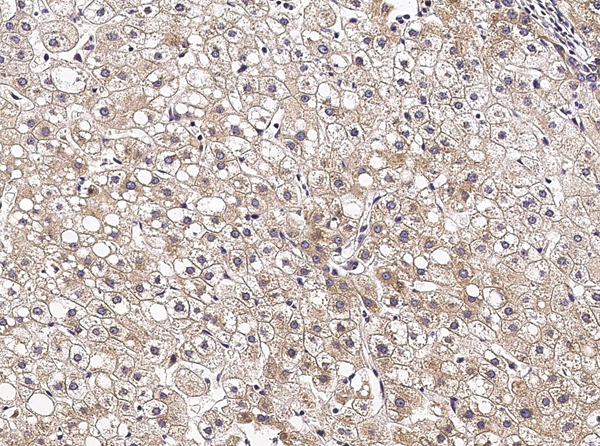
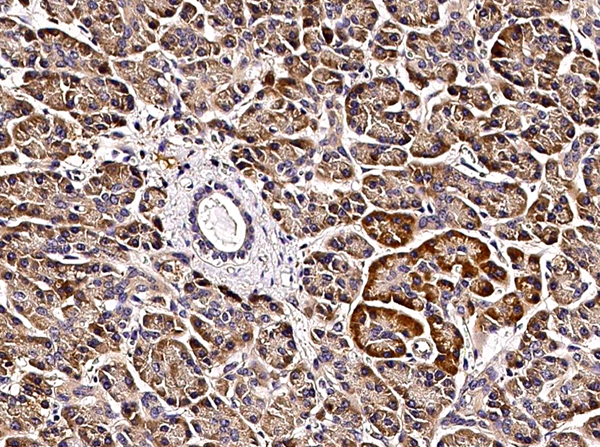
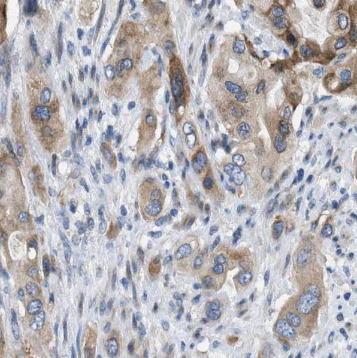
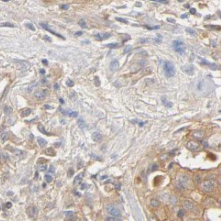
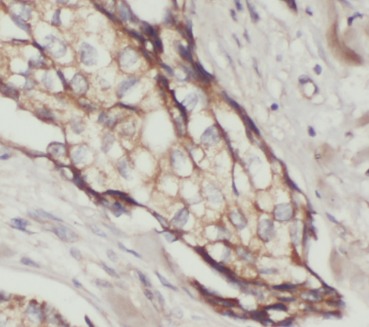
 IHC (Immunohiostchemistry)
(Immunochemical staining of human serpinD1 in human hepatoma with mouse monoclonal antibody (1:60, formalin-fixed paraffin embedded sections). Positive staining was localized to hepatocyte.)
IHC (Immunohiostchemistry)
(Immunochemical staining of human serpinD1 in human hepatoma with mouse monoclonal antibody (1:60, formalin-fixed paraffin embedded sections). Positive staining was localized to hepatocyte.)
SerpinD1, Monoclonal Antibody (Cat# AAA254806)
Kininogen 1, Monoclonal Antibody (Cat# AAA254992)
IL21, Monoclonal Antibody (Cat# AAA255015)

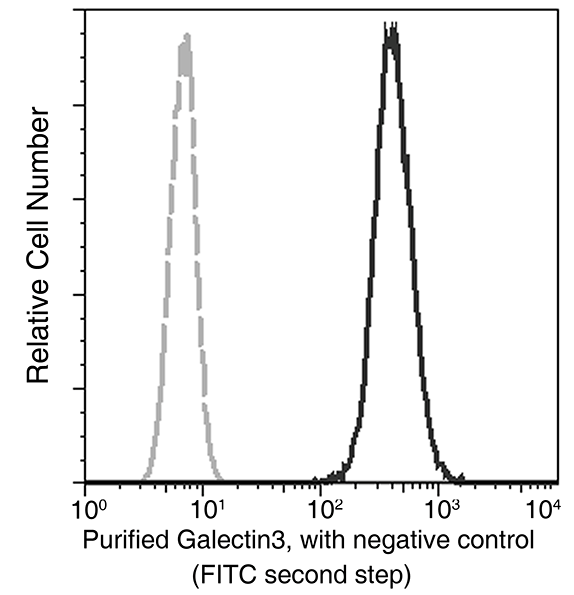
 FCM/FACS (Flow Cytometry)
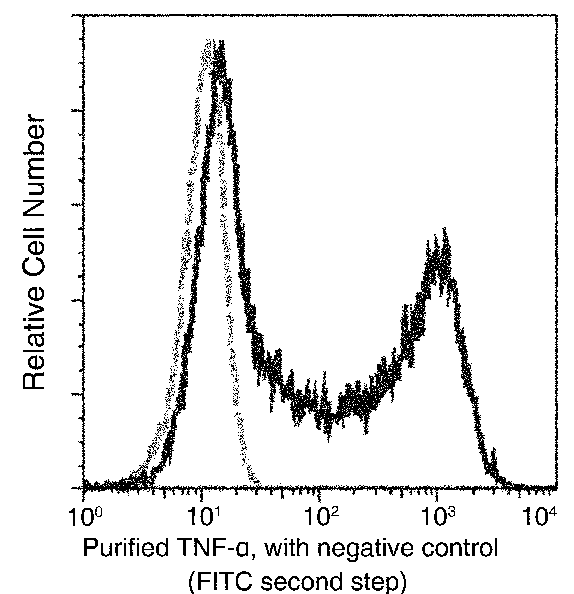
(Flow cytometric analysis of Human TNF-alpha expression on human peripheral blood lymphocytes. Human peripheral blood mononulcear cells were stimulated for 4-6 hours with PMA and Ionomycin in the presence of GolgiPlug. The cells were treated according to manufacturer's manual (BD Pharmingen'), stained with purified anti-Human TNF-alpha, then a FITC-conjugated second step antibody. The fluorescence histograms were derived from gated events with the forward and side light-scatter characteristics of viable lymphocytes.)
FCM/FACS (Flow Cytometry)
(Flow cytometric analysis of Human TNF-alpha expression on human peripheral blood lymphocytes. Human peripheral blood mononulcear cells were stimulated for 4-6 hours with PMA and Ionomycin in the presence of GolgiPlug. The cells were treated according to manufacturer's manual (BD Pharmingen'), stained with purified anti-Human TNF-alpha, then a FITC-conjugated second step antibody. The fluorescence histograms were derived from gated events with the forward and side light-scatter characteristics of viable lymphocytes.)
TNF-alpha/TNFA/TNFSF2, Monoclonal Antibody (Cat# AAA255020)
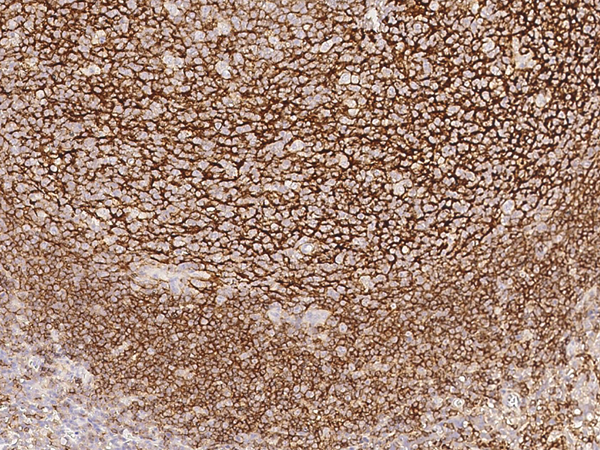
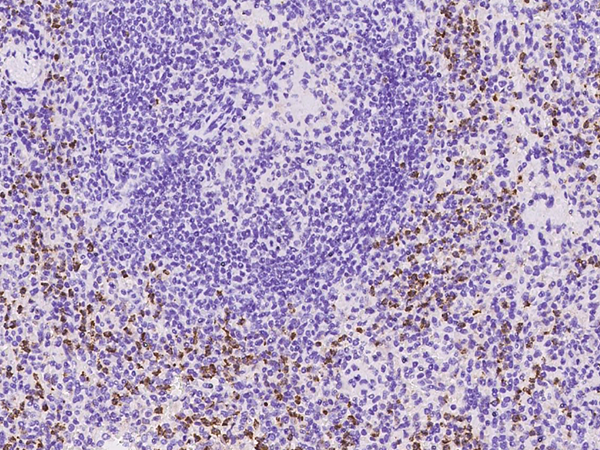
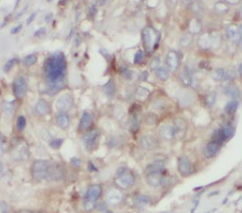
 IHC (Immunohistochemistry)
(Immunochemical staining CD21 in Ferret spleen with mouse monoclonal antibody at 1:1000 dilution, formalin-fixed paraffin embedded sections.)
IHC (Immunohistochemistry)
(Immunochemical staining CD21 in Ferret spleen with mouse monoclonal antibody at 1:1000 dilution, formalin-fixed paraffin embedded sections.)
CD21, Monoclonal Antibody (Cat# AAA255182)
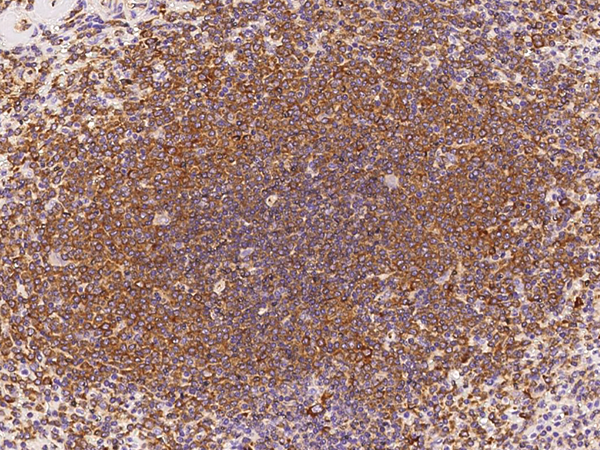
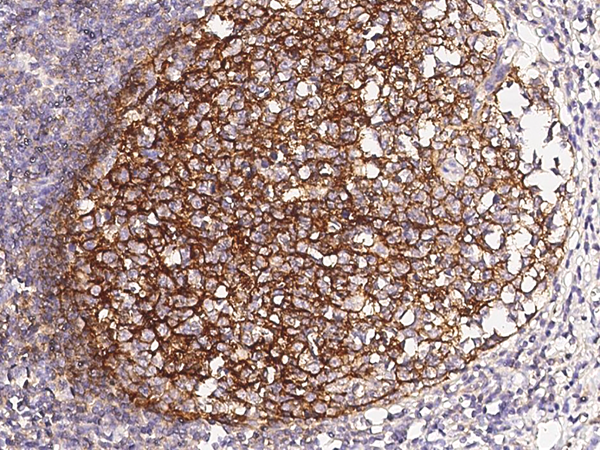
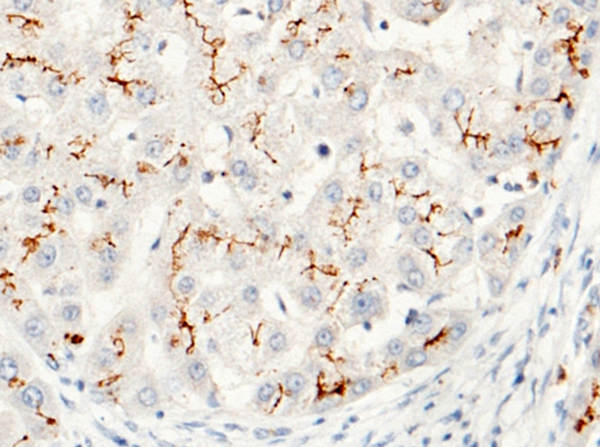
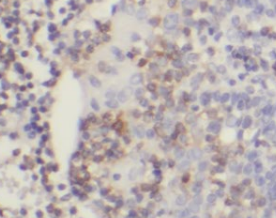
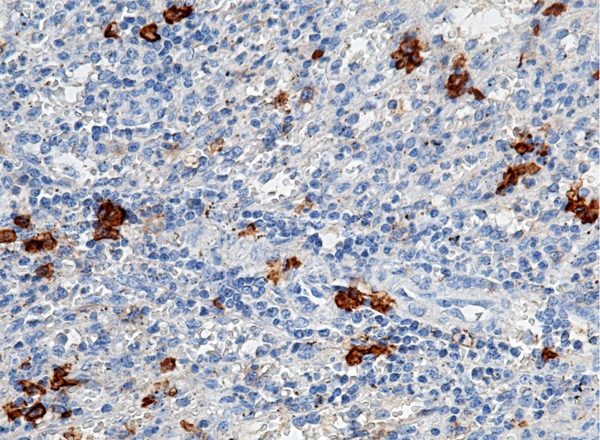 IHC (Immunohiostchemistry)
(Immunochemical staining of human CD38 in human spleen with rabbit monoclonal antibody (1:200, formalin-fixed paraffin embedded sections).)
IHC (Immunohiostchemistry)
(Immunochemical staining of human CD38 in human spleen with rabbit monoclonal antibody (1:200, formalin-fixed paraffin embedded sections).)
CD38, Monoclonal Antibody (Cat# AAA255198)
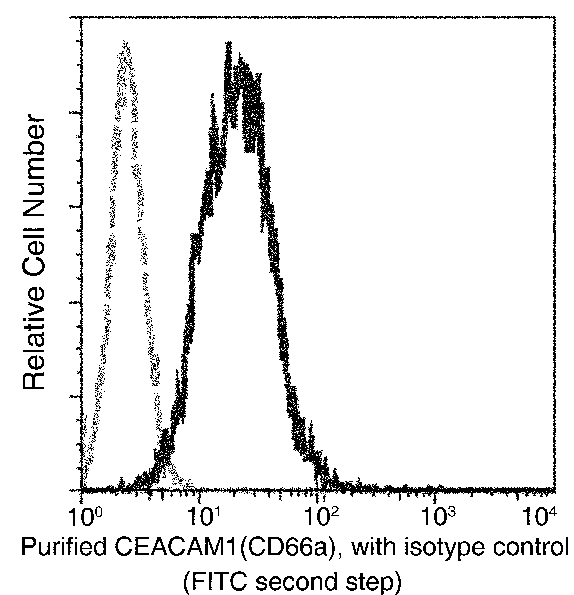 FCM/FACS (Flow Cytometry)
(Flow cytometric analysis of Human CEACAM1(CD66a) expression in HT-29 cells.)
FCM/FACS (Flow Cytometry)
(Flow cytometric analysis of Human CEACAM1(CD66a) expression in HT-29 cells.)
CEACAM1, Monoclonal Antibody (Cat# AAA255202)
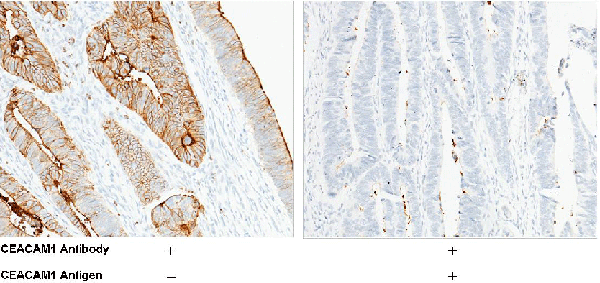
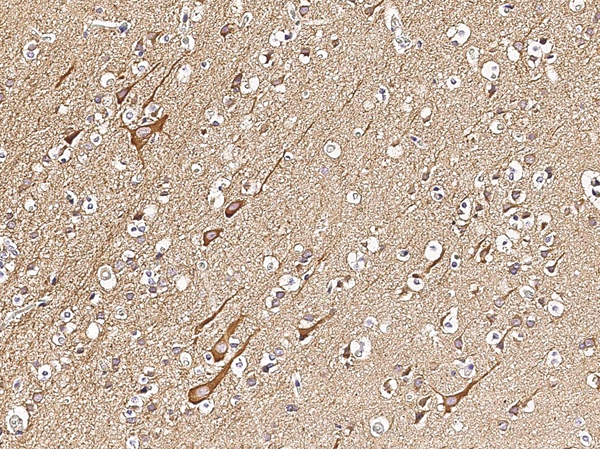
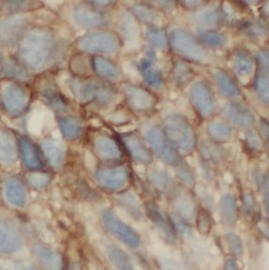
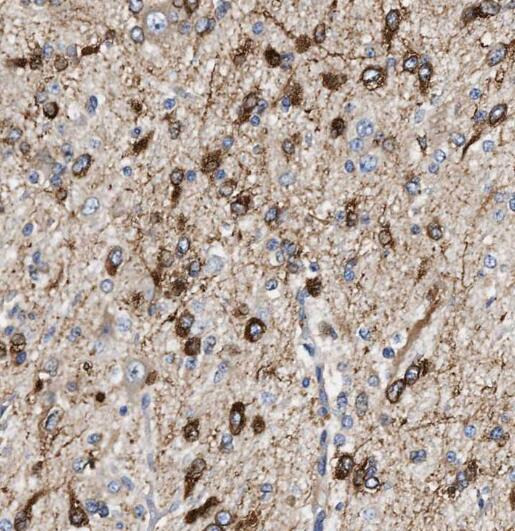
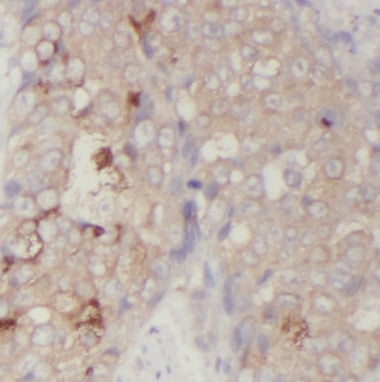
 IHC (Immunohistochemisry)
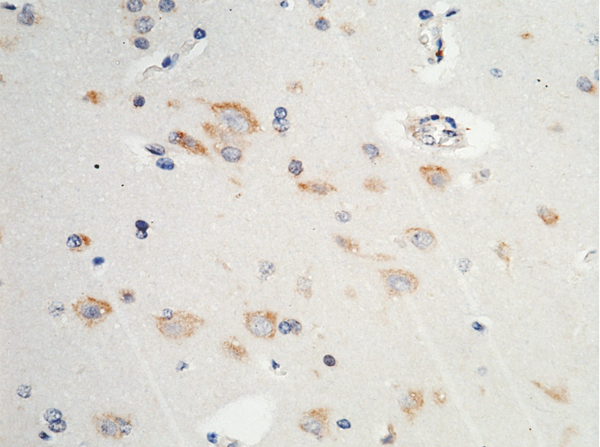
(Immunochemical staining of human P4HB in human brain with mouse monoclonal antibody (1:30, formalin-fixed paraffin embedded sections).)
IHC (Immunohistochemisry)
(Immunochemical staining of human P4HB in human brain with mouse monoclonal antibody (1:30, formalin-fixed paraffin embedded sections).)
P4HB, Monoclonal Antibody (Cat# AAA255211)
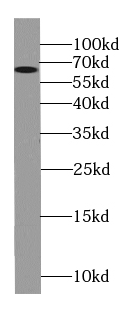
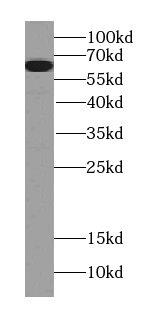
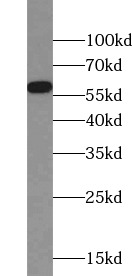
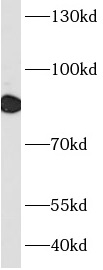
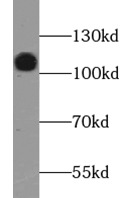
 WB (Western Blot)
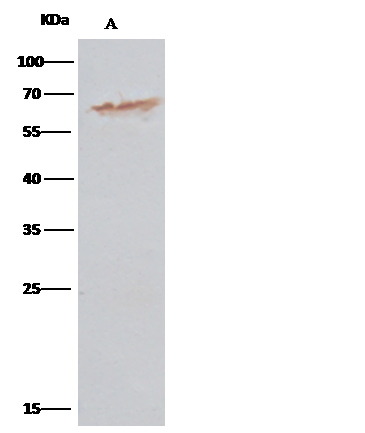
(Anti-P4HB rabbit monoclonal antibody at 1:100 dilutionLane A: MCF7 Whole Cell LysateLane B: HepG2 Whole Cell LysateLysates/proteins at 30 ug per lane.SecondaryGoat Anti-Rabbit IgG H&L (Dylight800) at 1/10000 dilution.Developed using the Odyssey technique.Performed under reducing conditions.Predicted band size:57 kDaObserved band size:57 kDa(We are unsure as to the identity of these extra bands.))
WB (Western Blot)
(Anti-P4HB rabbit monoclonal antibody at 1:100 dilutionLane A: MCF7 Whole Cell LysateLane B: HepG2 Whole Cell LysateLysates/proteins at 30 ug per lane.SecondaryGoat Anti-Rabbit IgG H&L (Dylight800) at 1/10000 dilution.Developed using the Odyssey technique.Performed under reducing conditions.Predicted band size:57 kDaObserved band size:57 kDa(We are unsure as to the identity of these extra bands.))
P4HB, Monoclonal Antibody (Cat# AAA255212)
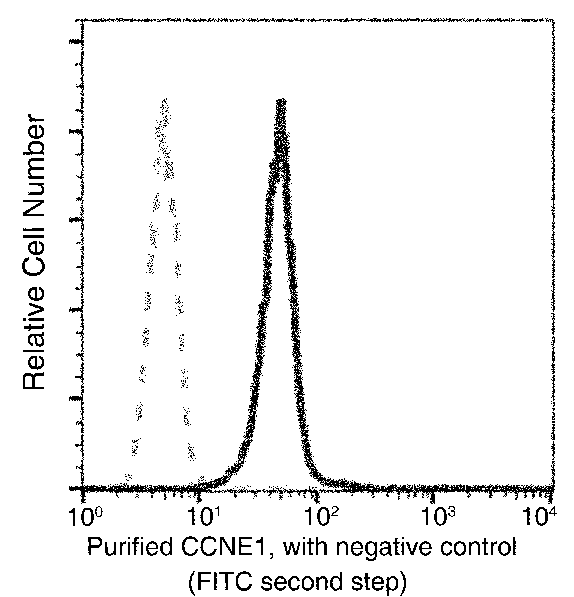
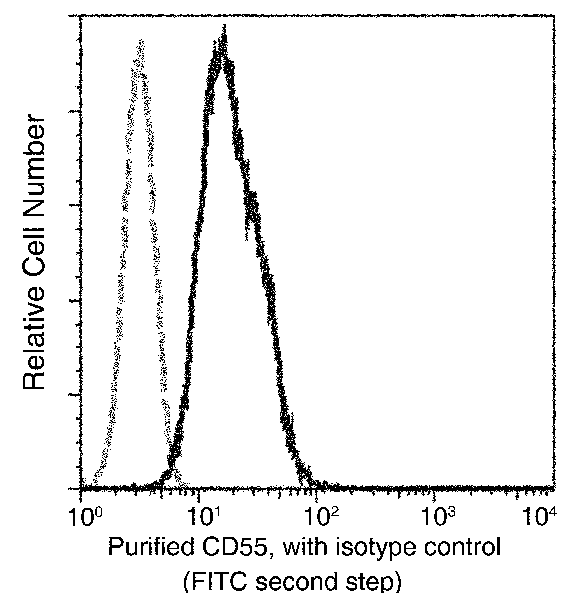
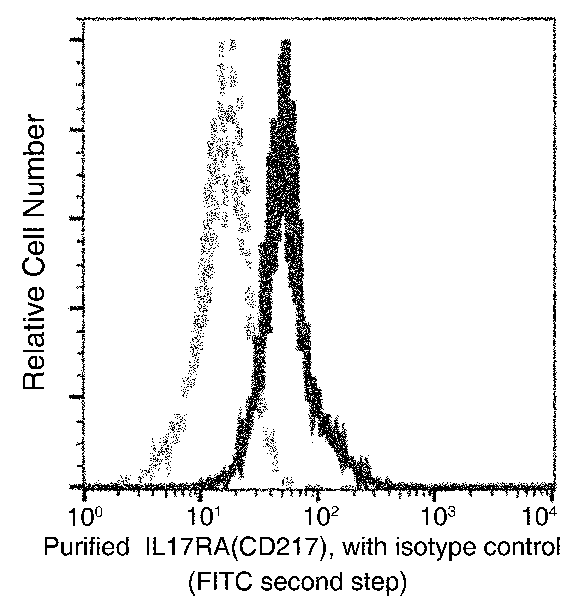 FCM/FACS (Flow Cytometry)
(Flow cytometric analysis of Human IL17RA(CD217) expression on human whole blood granulocytes. Cells were stained with purified anti-Human IL17RA(CD217), then a FITC-conjugated second step antibody. The fluorescence histograms were derived from gated events with the forward and side light-scatter characteristics of viable granulocytes.)
FCM/FACS (Flow Cytometry)
(Flow cytometric analysis of Human IL17RA(CD217) expression on human whole blood granulocytes. Cells were stained with purified anti-Human IL17RA(CD217), then a FITC-conjugated second step antibody. The fluorescence histograms were derived from gated events with the forward and side light-scatter characteristics of viable granulocytes.)
IL-17R/IL-17RA/CD217, Monoclonal Antibody (Cat# AAA255242)
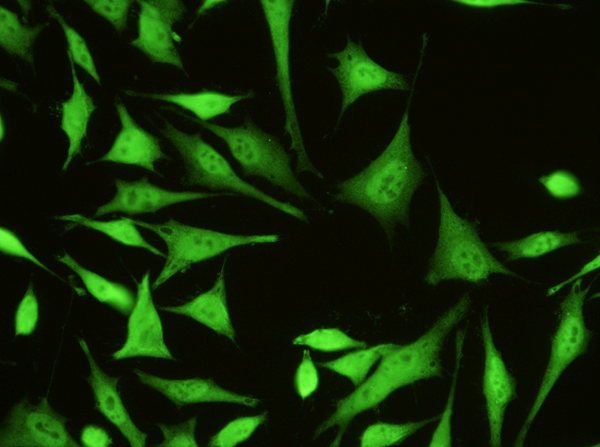
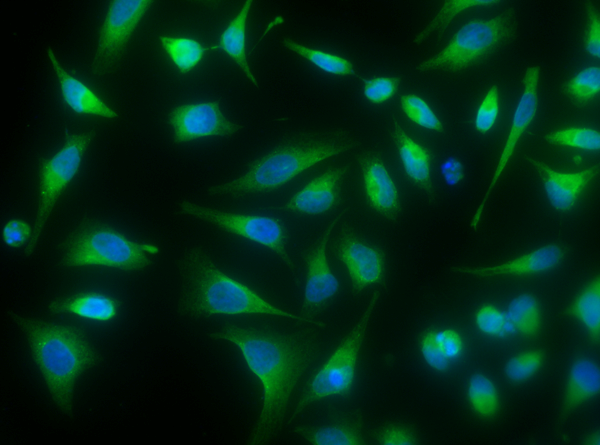
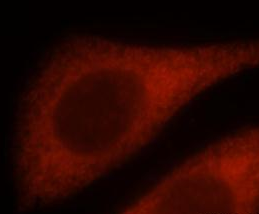
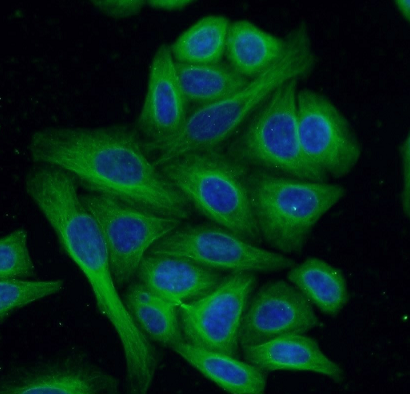
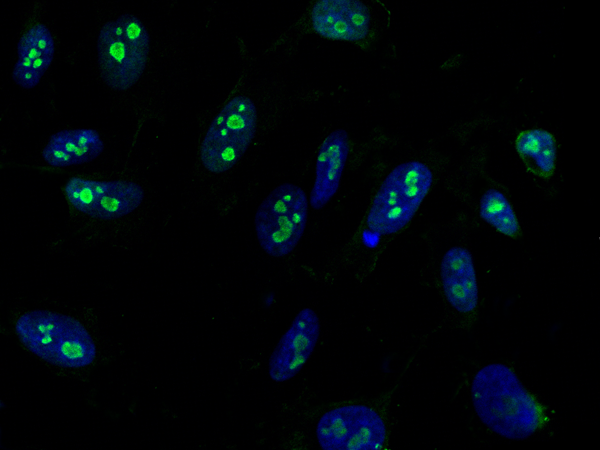 IF (Immunofluorescence)
(Immunofluorescence staining of CCNE1 in Hela cells. Cells were fixed with 4% PFA, permeabilzed with 0.1% Triton X-100 in PBS,blocked with 10% serum, and incubated with mouse anti-human CCNE1 monoclonal antibody (dilution ratio 1:60) at 4 degree C overnight. Then cells were stained with the Alexa Fluor488-conjugated Goat Anti-mouse IgG secondary antibody (green) and counterstained with DAPI (blue).Positive staining was localized to nucleolus.)
IF (Immunofluorescence)
(Immunofluorescence staining of CCNE1 in Hela cells. Cells were fixed with 4% PFA, permeabilzed with 0.1% Triton X-100 in PBS,blocked with 10% serum, and incubated with mouse anti-human CCNE1 monoclonal antibody (dilution ratio 1:60) at 4 degree C overnight. Then cells were stained with the Alexa Fluor488-conjugated Goat Anti-mouse IgG secondary antibody (green) and counterstained with DAPI (blue).Positive staining was localized to nucleolus.)
Cyclin E, Monoclonal Antibody (Cat# AAA255245)
 IHC (Immunohistochemistry)
(Immunochemical staining of human VAPB in human brain with rabbit monoclonal antibody (1:300, formalin-fixed paraffin embedded sections).)
IHC (Immunohistochemistry)
(Immunochemical staining of human VAPB in human brain with rabbit monoclonal antibody (1:300, formalin-fixed paraffin embedded sections).)
VAPB, Monoclonal Antibody (Cat# AAA255145)
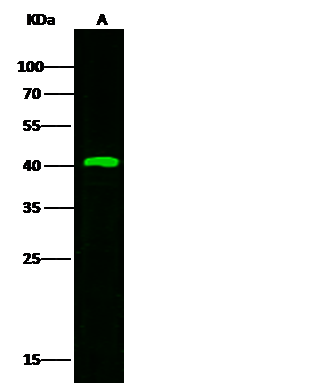
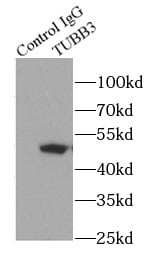
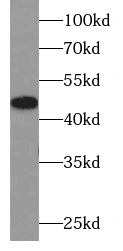
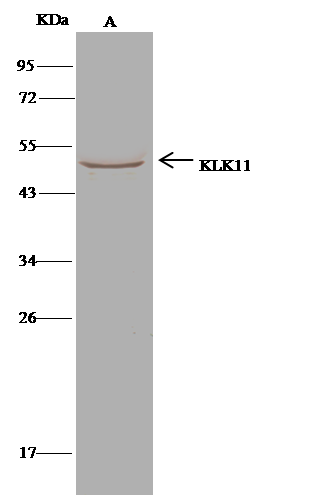 IP (Immunoprecipitation)
(KLK11 was immunoprecipitated using:Lane A:0.5 mg Hela Whole Cell Lysate1 uL anti-KLK11 rabbit monoclonal antibody and 15 ul of 50 % Protein G agarose.Primary antibody:Anti-KLK11 rabbit monoclonal antibody,at 1:500 dilutionSecondary antibody:Dylight 800-labeled antibody to rabbit IgG (H+L), at 1:5000 dilutionDeveloped using the odssey technique.Performed under reducing conditions.Predicted band size: 31 kDaObserved band size: 49 kDa)
IP (Immunoprecipitation)
(KLK11 was immunoprecipitated using:Lane A:0.5 mg Hela Whole Cell Lysate1 uL anti-KLK11 rabbit monoclonal antibody and 15 ul of 50 % Protein G agarose.Primary antibody:Anti-KLK11 rabbit monoclonal antibody,at 1:500 dilutionSecondary antibody:Dylight 800-labeled antibody to rabbit IgG (H+L), at 1:5000 dilutionDeveloped using the odssey technique.Performed under reducing conditions.Predicted band size: 31 kDaObserved band size: 49 kDa)
Kallikrein 11, Monoclonal Antibody (Cat# AAA255151)
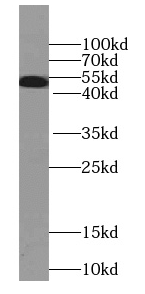
 WB (Western Blot)
(HeLa cells were subjected to SDS PAGE followed by western blot with AAA247946 (IFITM3 antibody) at dilution of 1:1000)
WB (Western Blot)
(HeLa cells were subjected to SDS PAGE followed by western blot with AAA247946 (IFITM3 antibody) at dilution of 1:1000)
IFITM3, Monoclonal Antibody (Cat# AAA247946)
Protein A+G purification
 WB (Western Blot)
(K-562 cells were subjected to SDS PAGE followed by western blot with AAA247948 (IGBP1 antibody) at dilution of 1:1000)
WB (Western Blot)
(K-562 cells were subjected to SDS PAGE followed by western blot with AAA247948 (IGBP1 antibody) at dilution of 1:1000)
IGBP1, Monoclonal Antibody (Cat# AAA247948)
Protein A+G purification
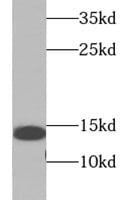
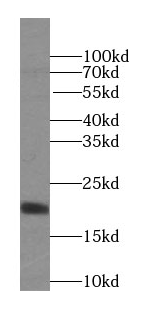
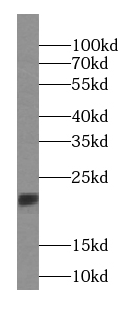
 WB (Western Blot)
(Recombinant protein were subjected to SDS PAGE followed by western blot with AAA247950 (IL-10 antibody at dilution of 1:5000)
WB (Western Blot)
(Recombinant protein were subjected to SDS PAGE followed by western blot with AAA247950 (IL-10 antibody at dilution of 1:5000)
IL-10, Monoclonal Antibody (Cat# AAA247950)
Protein A+G purification
 WB (Western Blot)
(PC-3 cells were subjected to SDS PAGE followed by western blot with AAA247989 (MLPH antibody) at dilution of 1:1000)
WB (Western Blot)
(PC-3 cells were subjected to SDS PAGE followed by western blot with AAA247989 (MLPH antibody) at dilution of 1:1000)
Melanophilin, Monoclonal Antibody (Cat# AAA247989)
Purity: > = 95% as determined by SDS-PAGE
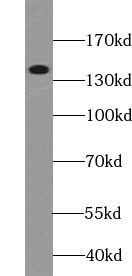 WB (Western Blot)
(fetal human brain tissue were subjected to SDS PAGE followed by western blot with AAA248007 (NCAM1 Antibody) at dilution of 1:4000)
WB (Western Blot)
(fetal human brain tissue were subjected to SDS PAGE followed by western blot with AAA248007 (NCAM1 Antibody) at dilution of 1:4000)
NCAM1/CD56, Monoclonal Antibody (Cat# AAA248007)
Protein A+G purification
 WB (Western Blot)
(K-562 cells were subjected to SDS PAGE followed by western blot with AAA248098 (STXBP2 Antibody) at dilution of 1:4000)
WB (Western Blot)
(K-562 cells were subjected to SDS PAGE followed by western blot with AAA248098 (STXBP2 Antibody) at dilution of 1:4000)
STXBP2, Monoclonal Antibody (Cat# AAA248098)
Protein A+G purification
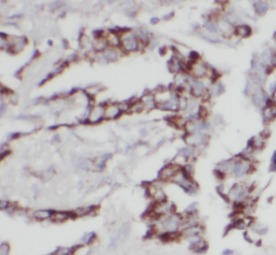
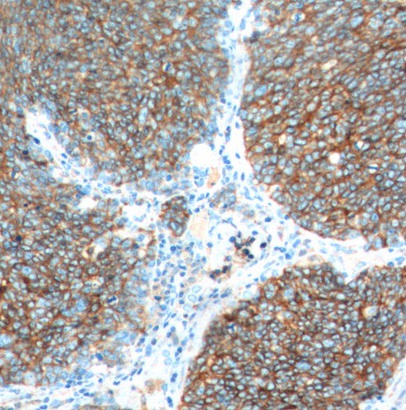
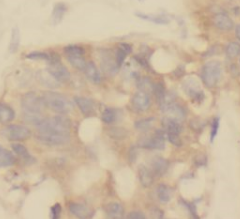
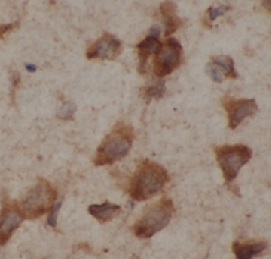
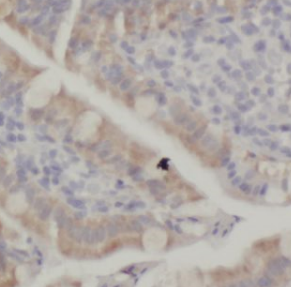
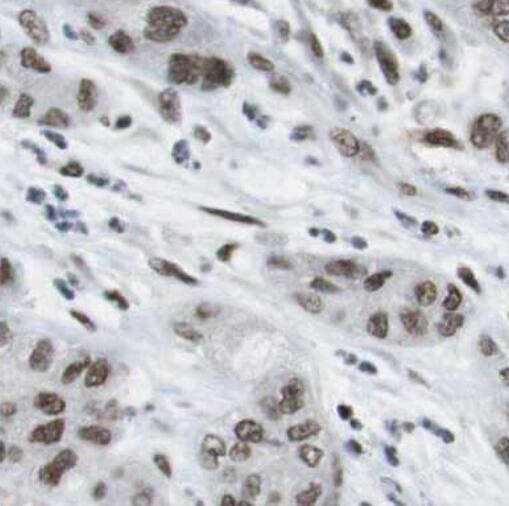
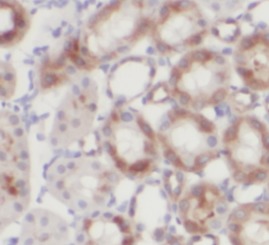
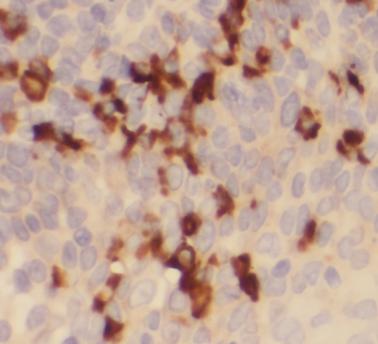
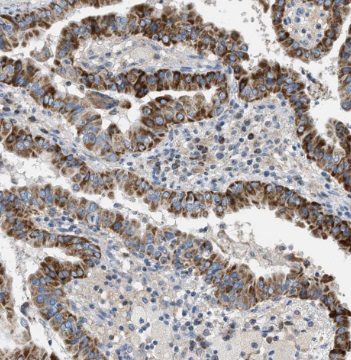 IHC (Immunohistochemistry)
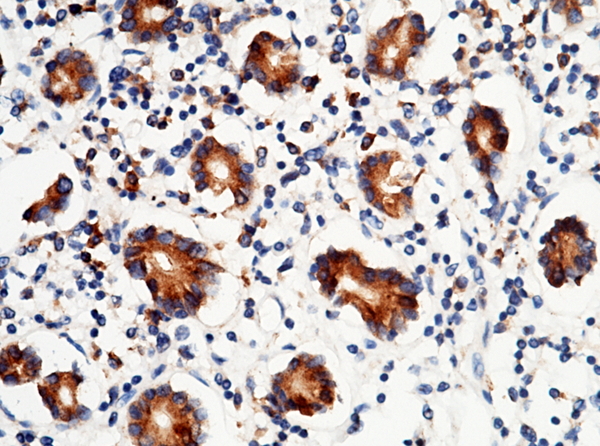
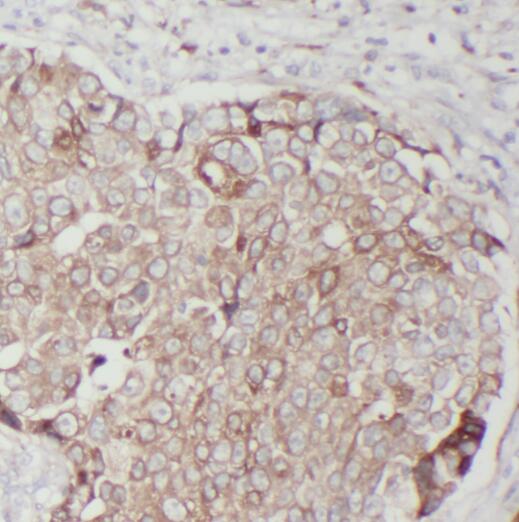
(Immunohistochemistry of paraffin-embedded human thyroid cancer tissue slide using AAA248107 (Thyroglobulin antibody) at dilution of 1:200)
IHC (Immunohistochemistry)
(Immunohistochemistry of paraffin-embedded human thyroid cancer tissue slide using AAA248107 (Thyroglobulin antibody) at dilution of 1:200)
Thyroglobulin, Monoclonal Antibody (Cat# AAA248107)
Protein A+G purification
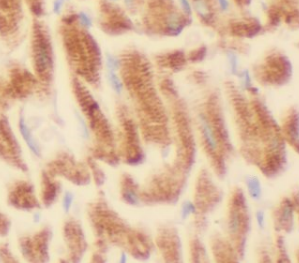
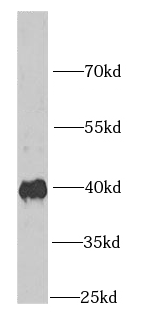
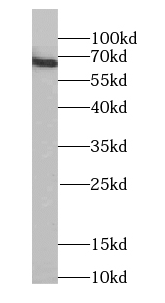
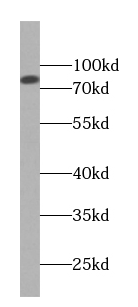 WB (Western Blot)
(human heart tissue were subjected to SDS PAGE followed by western blot with AAA248123 (TRPC4AP antibody) at dilution of 1:500)
WB (Western Blot)
(human heart tissue were subjected to SDS PAGE followed by western blot with AAA248123 (TRPC4AP antibody) at dilution of 1:500)
TRPC4AP, Monoclonal Antibody (Cat# AAA248123)
Protein A+G purification
 WB (Western Blot)
(RAW 264.7 cells were subjected to SDS PAGE followed by western blot with AAA248127 (Tubulin-beta Antibody) at dilution of 1:10000)
WB (Western Blot)
(RAW 264.7 cells were subjected to SDS PAGE followed by western blot with AAA248127 (Tubulin-beta Antibody) at dilution of 1:10000)
Tubulin-beta, Monoclonal Antibody (Cat# AAA248127)
Protein A+G purification
 WB (Western Blot)
(Untransfected and NINJ2 transfected HEK-293 cells were subjected to SDS-PAGE followed by western blot with AAA248015 (mouse anti-NINJ2 monoclonal antibody,1:1000) and mouse anti-6*His tag respectively.)
WB (Western Blot)
(Untransfected and NINJ2 transfected HEK-293 cells were subjected to SDS-PAGE followed by western blot with AAA248015 (mouse anti-NINJ2 monoclonal antibody,1:1000) and mouse anti-6*His tag respectively.)
NINJ2, Monoclonal Antibody (Cat# AAA248015)
Protein A+G purification
 WB (Western Blot)
(HL-60 cells were subjected to SDS PAGE followed by western blot with AAA248025 (ORAI1 Antibody) at dilution of 1:1000)
WB (Western Blot)
(HL-60 cells were subjected to SDS PAGE followed by western blot with AAA248025 (ORAI1 Antibody) at dilution of 1:1000)
ORAI1, Monoclonal Antibody (Cat# AAA248025)
Protein A+G purification
 WB (Western Blot)
(HepG2 cells were subjected to SDS PAGE followed by western blot with AAA248042 (PGM1 antibody) at dilution of 1:1000)
WB (Western Blot)
(HepG2 cells were subjected to SDS PAGE followed by western blot with AAA248042 (PGM1 antibody) at dilution of 1:1000)
PGM1, Monoclonal Antibody (Cat# AAA248042)
Protein A+G purification
 WB (Western Blot)
(Jurkat cells were subjected to SDS PAGE followed by western blot with AAA248043 (Phospho-Akt (S473) Antibody) at dilution of 1:2000)
WB (Western Blot)
(Jurkat cells were subjected to SDS PAGE followed by western blot with AAA248043 (Phospho-Akt (S473) Antibody) at dilution of 1:2000)
Phospho-Akt (Tyr315), Monoclonal Antibody (Cat# AAA248043)
Protein A+G purification
 WB (Western Blot)
(A549 cells were subjected to SDS PAGE followed by western blot with AAA248064 (RBBP9 antibody) at dilution of 1:500)
WB (Western Blot)
(A549 cells were subjected to SDS PAGE followed by western blot with AAA248064 (RBBP9 antibody) at dilution of 1:500)
RBBP9, Monoclonal Antibody (Cat# AAA248064)
Protein A+G purification
 WB (Western Blot)
(K-562 cells were subjected to SDS PAGE followed by western blot with AAA248074 (RRM1 antibody) at dilution of 1:1000)
WB (Western Blot)
(K-562 cells were subjected to SDS PAGE followed by western blot with AAA248074 (RRM1 antibody) at dilution of 1:1000)
RRM1, Monoclonal Antibody (Cat# AAA248074)
Protein A+G purification
 WB (Western Blot)
(HeLa cells were subjected to SDS PAGE followed by western blot with AAA248082 (SEPT8 Antibody) at dilution of 1:1000)
WB (Western Blot)
(HeLa cells were subjected to SDS PAGE followed by western blot with AAA248082 (SEPT8 Antibody) at dilution of 1:1000)
SEPT8, Monoclonal Antibody (Cat# AAA248082)
Protein A+G purification
 WB (Western Blot)
(HEK-293 cells were subjected to SDS PAGE followed by western blot with AAA249037 (LAMP2 antibody) at dilution of 1:1000)
WB (Western Blot)
(HEK-293 cells were subjected to SDS PAGE followed by western blot with AAA249037 (LAMP2 antibody) at dilution of 1:1000)
LAMP2, Monoclonal Antibody (Cat# AAA249037)
Protein A+G Purification
 WB (Western Blot)
(Hela cells were subjected to SDS PAGE followed by western blot with AAA249043 (SLC2A1,GLUT1 antibody) at dilution of 1:1000)
WB (Western Blot)
(Hela cells were subjected to SDS PAGE followed by western blot with AAA249043 (SLC2A1,GLUT1 antibody) at dilution of 1:1000)
GLUT1, Monoclonal Antibody (Cat# AAA249043)
Protein A+G Purified
 WB (Western Blot)
(human plasma tissue were subjected to SDS PAGE followed by western blot with AAA249048 (IGHG4 Antibody) at dilution of 1:50000)
WB (Western Blot)
(human plasma tissue were subjected to SDS PAGE followed by western blot with AAA249048 (IGHG4 Antibody) at dilution of 1:50000)
IgG4, Monoclonal Antibody (Cat# AAA249048)
Protein G Purified
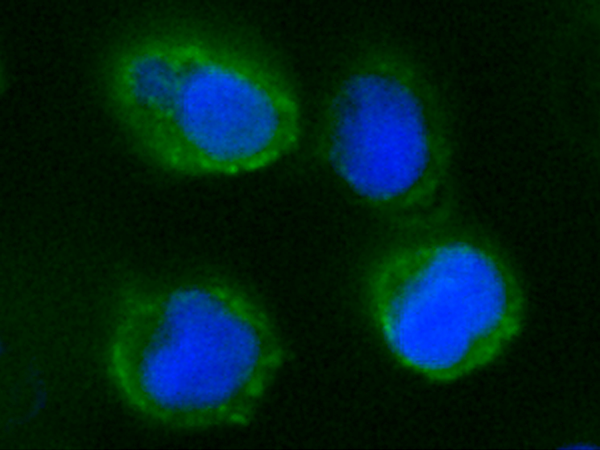 IF (Immunofluorescence)
(Immunofluorescence staining of Human CD55 in JURKAT cells. Cells were fixed with 4% PFA, blocked with 10% serum, and incubated with Rabbit anti-Human CD55 monoclonal antibody (1:60) at 37 degree C 1 hour. Then cells were stained with the Alexa Fluor 488-conjugated Goat Anti-rabbit IgG secondary antibody (green) and counterstained with DAPI (blue). Positive staining was localized to plasma membrane.)
IF (Immunofluorescence)
(Immunofluorescence staining of Human CD55 in JURKAT cells. Cells were fixed with 4% PFA, blocked with 10% serum, and incubated with Rabbit anti-Human CD55 monoclonal antibody (1:60) at 37 degree C 1 hour. Then cells were stained with the Alexa Fluor 488-conjugated Goat Anti-rabbit IgG secondary antibody (green) and counterstained with DAPI (blue). Positive staining was localized to plasma membrane.)
CD55/DAF, Monoclonal Antibody (Cat# AAA254435)
What are Monoclonal Antibodies?
Monoclonal antibodies are specialized laboratory-produced proteins developed for binding to specific biological antigens or other molecular targets. Since they come from a single cell (or clone), they are especially consistent and accurate in the data they are involved in producing.
This type of antibody material has been shown to be a powerful tool in finding and subsequently destroying harmful cells in an organism, such as those found in cancers or various autoimmune diseases. This makes them excellent aids in medical testing and research, which is why they are so widely used.
AAA Biotech offers a comprehensive range of high-quality monoclonal antibodies that perform effectively in various laboratory tests, including (amongst others) ELISA, western blotting, immunohistochemistry, and flow cytometry. All of the products in our catalog are thoroughly quality tested to make sure that they are reliable and will consistently perform well in your research.
What Are The Uses of Monoclonal Antibodies
Monoclonal antibodies are used in many lab tests, including (amongst others) ELISA, western blotting, immunohistochemistry, and flow cytometry.
ELISA is a test that helps detect a specific substance/analyte in a sample. It uses antibodies (often monoclonal) bound to a solid surface (such as the well of a microplate) to “capture” the substance/analyte in the sample and immobilize it so that the detection antibody component can then bind to it and produce a signal, which can then be measured.
Western blotting identifies specific proteins in a sample. The sample is first separated on a gel, and then antibodies are applied that will typically bind to the target, which will all be localized to a single band in a lane.
Immunohistochemistry helps locate specific proteins in cells or tissue samples using antibodies.
Flow cytometry looks at and sorts cells. It uses antibodies that are conjugated to reporter molecules called “fluorophores”, which, under special lights, emit light themselves, which can then be measured by a detector instrument.
How Monoclonal Antibodies Are Used as Medicine?
Please note that all of the products listed in AAA Biotech’s also known as AAA Bio or AAABio catalog are strictly for research-use only (RUO).
Monoclonal antibodies can also be used as therapeutic/medical treatments, particularly in the context of cancers. They are designed to find and bind to specific cells or proteins, helping the immune system recognize and attack the cancer. These treatments work in different ways, such as:
- Radioimmunotherapy attaches a small amount of radioactive molecule to the antibody, so it delivers the radiation directly to the cancer cells that the antibody is specifically binding to.
- Antibody-directed enzyme prodrug therapy uses antibodies that are specifically bound to special enzymes. These enzymes activate a harmless drug in the body and turn it into a cancer-killing drug only near the cancer cells—this helps avoid harming healthy cells.
- Immunoliposomes are tiny “bubbles” filled with medicine/drug and coated with antibodies. They carry the drug straight to the cancer cells.
Why Buy Monoclonal Antibodies From Us?
At AAA Biotech, we provide high-performance monoclonal antibodies designed to support a wide range of research needs.
1. Validated for Versatile Applications
The antibodies in our catalog are extensively validated and compatible with multiple techniques, including (but not limited to) ELISA, flow cytometry (FC), immunocytochemistry (ICC), immunofluorescence (IF), immunohistochemistry (IHC), immunoprecipitation (IP), and western blotting (WB).
2. Wide Selection & Specialized Options
We offer antibodies for common and rare species, that are available in various conjugated forms, and also in recombinant formats. Essentially, there is almost anything one might need to meet their experimental model’s requirements.
3. High-Quality Proteins
Our proteins meet high purity standards—90% or more as confirmed by SDS-PAGE. Many are available with tags like His, Flag, GST, or MBP, and we also supply native and biologically active proteins for functional studies.
Frequently Asked Questions
1. Are your monoclonal antibodies validated for specific applications?
Yes, our antibodies are tested and validated for use in methods such as ELISA, western blot, IHC, flow cytometry, and more. Refer to specific product pages or datasheets for individual product information.
2. How do I choose the right monoclonal antibody for my application?
Review the product details directly for application validation, species reactivity, and target information. You may also contact our support team at any time for help.
3. How quickly can I receive my order?
Most orders are processed and shipped within 1–3 business days, depending on product availability and your shipping location.