Filters
Clonality
Type
Reactivity
Gene Name
Isotype
Host
Application
Clone
32 results for "Neuroinflammation" - showing 1-32


 Application Data
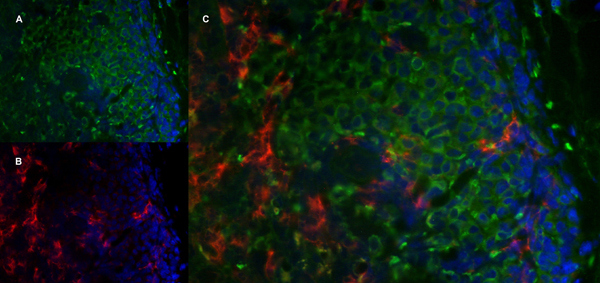
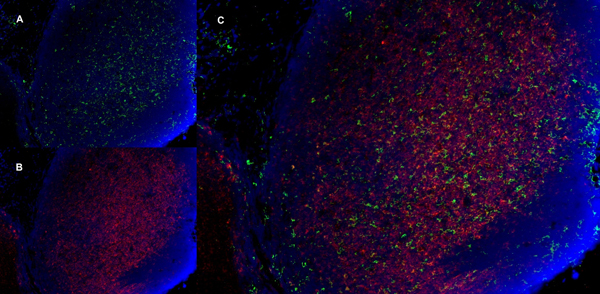
(Published customer image: Increased accumulation of repair-associated macrophages surrounding collaterals in ischemic hind limbs is PAR2-dependent. (A) Stainings of CD206-positive macrophages (green) and SMA-positive vessels (red) in non-ischemic (control) and ischemic (ligated) hind limbs of WT, PAR1-/- and PAR2-/- mice are shown. Nuclei were visualized with DAPI (blue). Arrows indicate single macrophages in the non-ischemic adductor. Quantification of the average number of repair-associated macrophages per vessel is indicated on the right. (B) Correlation between the number of CD206-positive macrophages in the ischemic tissues and the expression of CD11b and (C) CD115 on monocytes. ** p)
Application Data
(Published customer image: Increased accumulation of repair-associated macrophages surrounding collaterals in ischemic hind limbs is PAR2-dependent. (A) Stainings of CD206-positive macrophages (green) and SMA-positive vessels (red) in non-ischemic (control) and ischemic (ligated) hind limbs of WT, PAR1-/- and PAR2-/- mice are shown. Nuclei were visualized with DAPI (blue). Arrows indicate single macrophages in the non-ischemic adductor. Quantification of the average number of repair-associated macrophages per vessel is indicated on the right. (B) Correlation between the number of CD206-positive macrophages in the ischemic tissues and the expression of CD11b and (C) CD115 on monocytes. ** p)
CD206, Monoclonal Antibody (Cat# AAA12117)
Full Name
RAT ANTI MOUSE CD206:Biotin
Gene Names
Mrc1; MR; CD206; AW259686
Applications
Flow Cytometry
Pricing


 Application Data
(Published customer image: Increased accumulation of repair-associated macrophages surrounding collaterals in ischemic hind limbs is PAR2-dependent. (A) Stainings of CD206-positive macrophages (green) and SMA-positive vessels (red) in non-ischemic (control) and ischemic (ligated) hind limbs of WT, PAR1-/- and PAR2-/- mice are shown. Nuclei were visualized with DAPI (blue). Arrows indicate single macrophages in the non-ischemic adductor. Quantification of the average number of repair-associated macrophages per vessel is indicated on the right. (B) Correlation between the number of CD206-positive macrophages in the ischemic tissues and the expression of CD11b and (C) CD115 on monocytes. ** p)
Application Data
(Published customer image: Increased accumulation of repair-associated macrophages surrounding collaterals in ischemic hind limbs is PAR2-dependent. (A) Stainings of CD206-positive macrophages (green) and SMA-positive vessels (red) in non-ischemic (control) and ischemic (ligated) hind limbs of WT, PAR1-/- and PAR2-/- mice are shown. Nuclei were visualized with DAPI (blue). Arrows indicate single macrophages in the non-ischemic adductor. Quantification of the average number of repair-associated macrophages per vessel is indicated on the right. (B) Correlation between the number of CD206-positive macrophages in the ischemic tissues and the expression of CD11b and (C) CD115 on monocytes. ** p)
CD206, Monoclonal Antibody (Cat# AAA12122)
Full Name
RAT ANTI MOUSE CD206:FITC
Gene Names
Mrc1; MR; CD206; AW259686
Applications
Flow Cytometry
Pricing


 Application Data
(Published customer image: Increased accumulation of repair-associated macrophages surrounding collaterals in ischemic hind limbs is PAR2-dependent. (A) Stainings of CD206-positive macrophages (green) and SMA-positive vessels (red) in non-ischemic (control) and ischemic (ligated) hind limbs of WT, PAR1-/- and PAR2-/- mice are shown. Nuclei were visualized with DAPI (blue). Arrows indicate single macrophages in the non-ischemic adductor. Quantification of the average number of repair-associated macrophages per vessel is indicated on the right. (B) Correlation between the number of CD206-positive macrophages in the ischemic tissues and the expression of CD11b and (C) CD115 on monocytes. ** p)
Application Data
(Published customer image: Increased accumulation of repair-associated macrophages surrounding collaterals in ischemic hind limbs is PAR2-dependent. (A) Stainings of CD206-positive macrophages (green) and SMA-positive vessels (red) in non-ischemic (control) and ischemic (ligated) hind limbs of WT, PAR1-/- and PAR2-/- mice are shown. Nuclei were visualized with DAPI (blue). Arrows indicate single macrophages in the non-ischemic adductor. Quantification of the average number of repair-associated macrophages per vessel is indicated on the right. (B) Correlation between the number of CD206-positive macrophages in the ischemic tissues and the expression of CD11b and (C) CD115 on monocytes. ** p)
CD206, Monoclonal Antibody (Cat# AAA12125)
Full Name
RAT ANTI MOUSE CD206:RPE
Gene Names
Mrc1; MR; CD206; AW259686
Applications
Flow Cytometry
Pricing


 Application Data
(Staining of mouse peritoneal macrophages with Rat anti Mouse CD11b)
Application Data
(Staining of mouse peritoneal macrophages with Rat anti Mouse CD11b)
CD11b, Monoclonal Antibody (Cat# AAA12057)
Full Name
RAT ANTI MOUSE CD11b:RPE
Gene Names
Itgam; CR3; CR3A; MAC1; Cd11b; Ly-40; Mac-1; Mac-1a; CD11b/CD18; F730045J24Rik
Applications
Flow Cytometry
Pricing


 Application Data
(Published customer image: Increased accumulation of repair-associated macrophages surrounding collaterals in ischemic hind limbs is PAR2-dependent. (A) Stainings of CD206-positive macrophages (green) and SMA-positive vessels (red) in non-ischemic (control) and ischemic (ligated) hind limbs of WT, PAR1-/- and PAR2-/- mice are shown. Nuclei were visualized with DAPI (blue). Arrows indicate single macrophages in the non-ischemic adductor. Quantification of the average number of repair-associated macrophages per vessel is indicated on the right. (B) Correlation between the number of CD206-positive macrophages in the ischemic tissues and the expression of CD11b and (C) CD115 on monocytes. ** p)
Application Data
(Published customer image: Increased accumulation of repair-associated macrophages surrounding collaterals in ischemic hind limbs is PAR2-dependent. (A) Stainings of CD206-positive macrophages (green) and SMA-positive vessels (red) in non-ischemic (control) and ischemic (ligated) hind limbs of WT, PAR1-/- and PAR2-/- mice are shown. Nuclei were visualized with DAPI (blue). Arrows indicate single macrophages in the non-ischemic adductor. Quantification of the average number of repair-associated macrophages per vessel is indicated on the right. (B) Correlation between the number of CD206-positive macrophages in the ischemic tissues and the expression of CD11b and (C) CD115 on monocytes. ** p)
CD206, Monoclonal Antibody (Cat# AAA12120)
Full Name
RAT ANTI MOUSE CD206:FITC
Gene Names
Mrc1; MR; CD206; AW259686
Applications
Flow Cytometry
Pricing


 Application Data
(Published Customer Image:Mouse CD31 antibody, clone ER-MP12 used for the demonstration of vasculature in mouse brain by immunofluorescence.Image caption:Inhibition of 2-AG hydrolysis reduces LPS-induced BBB permeability. a, b Fibrinogen levels in b plasma and the a ratio of brain to plasma fibrinogen were assessed by ELISA. n?=?5/7 mice per group. c, d Fluorescent immunostaining in the striatum for fibrinogen (red) and vascular marker (CD31; green) demonstrated leakage of fibrinogen into the brain with vehicle treatment, whereas vascular integrity was preserved when (e, f) MAGL was inhibited. g Extravascular fibrinogen was semi-quantitated in fluorescently labeled sections of the striatum. Bar graphs were plotted with mean?+/-SEM and data analyzed using one-way analysis of variance (ANOVA) with Tukey post-hoc comparisons. n = 5/7 mice per group. Significance is shown as *p?)
Application Data
(Published Customer Image:Mouse CD31 antibody, clone ER-MP12 used for the demonstration of vasculature in mouse brain by immunofluorescence.Image caption:Inhibition of 2-AG hydrolysis reduces LPS-induced BBB permeability. a, b Fibrinogen levels in b plasma and the a ratio of brain to plasma fibrinogen were assessed by ELISA. n?=?5/7 mice per group. c, d Fluorescent immunostaining in the striatum for fibrinogen (red) and vascular marker (CD31; green) demonstrated leakage of fibrinogen into the brain with vehicle treatment, whereas vascular integrity was preserved when (e, f) MAGL was inhibited. g Extravascular fibrinogen was semi-quantitated in fluorescently labeled sections of the striatum. Bar graphs were plotted with mean?+/-SEM and data analyzed using one-way analysis of variance (ANOVA) with Tukey post-hoc comparisons. n = 5/7 mice per group. Significance is shown as *p?)
CD31, Monoclonal Antibody (Cat# AAA12258)
Full Name
Rat Anti Mouse CD31: FITC
Gene Names
Pecam1; Cd31; Pecam; C85791; PECAM-1
Reactivity
Mouse
Applications
Flow Cytometry
Purity
Purified IgG prepared by affinity chromatography on Protein G from tissue culture supernatant
Pricing


 Application Data
(Staining of mouse peritoneal macrophages with Rat anti Mouse CD11b)
Application Data
(Staining of mouse peritoneal macrophages with Rat anti Mouse CD11b)
CD11b, Monoclonal Antibody (Cat# AAA11889)
Full Name
RAT ANTI MOUSE CD11b:FITC
Gene Names
Itgam; CR3; CR3A; MAC1; Cd11b; Ly-40; Mac-1; Mac-1a; CD11b/CD18; F730045J24Rik
Applications
Flow Cytometry
Pricing


 Application Data
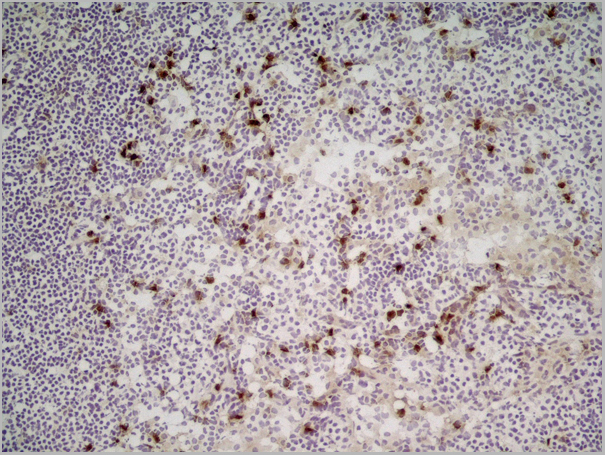
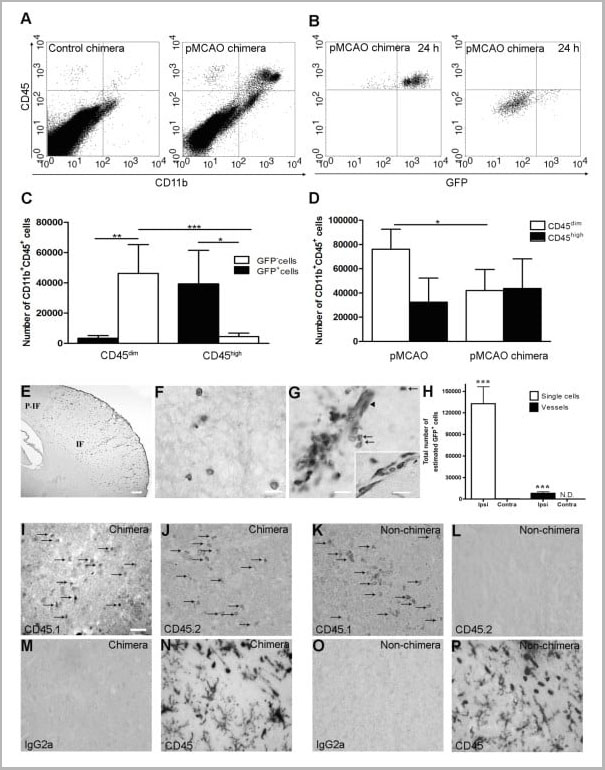
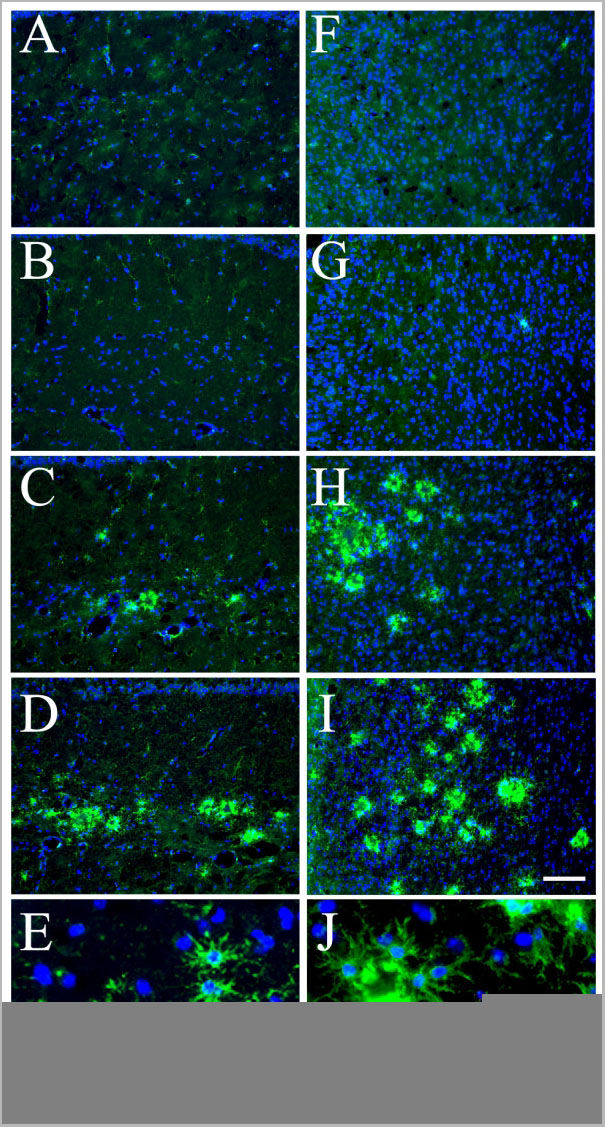
(Published customer image Infiltration of GFP+ BM-cells in infarct and peri-infarct regions. (A-B) Dot plots of viable macrophages/granulocytes (CD11b+CD45high, top right quadrants) and microglia (CD11b+CD45dim, bottom right quadrants) in cortex from BM-chimeric unmanipulated mice and mice exposed to pMCAO. (C) Bar graph showing mean numbers of CD11b+CD45dim microglia and CD11b+CD45high macrophages/granulocytes in BM-chimeric mice 24 hours after pMCAO, subdivided based on expression of GFP (n = 5). Approximately 92% of of the CD45high population were GFP+. (D) Estimation and comparison of mean numbers of CD11b+CD45dim microglia in non-chimeric (n = 10) versus BM-chimeric mice (n = 5) 24 hours after of pMCAO shows significantly fewer CD11b+CD45dim microglial cells in irradiated mice. (E) Overview, showing distribution of infiltrating GFP+ BM-derived cells into infarct (IF) and peri-infarct (P-IF) regions 24 hours after pMCAO. (E-G) By 24 hours, GFP+ single cells (F) and vessel-associated aggregates of GFP+ cells (arrows in G) were observed in infarct and peri-infarct regions. Some of the vessel-associated cells were round, leukocyte-like cells (arrows) while others were elongated cells lining the vasculature (arrow heads in G and in insert). (H) Bar graph showing mean numbers of single GFP+ cells and vessel-associated aggregates of GFP+ cells in ipsi- and contralateral cortex 24 hours after surgery (n = 10). (I-P) Immunohistochemical staining of CD45.1 (I, K), CD45.2 (J, L), IgG2a (M, O) and CD45 (N, P) in ischemic tissue in BM-chimeric (I, J, M, N) and non-chimeric mice (K, L, O, P) 24 hours after pMCAO. N.D, none detected. Scale bars: 200 um (A), 10 um (B, C). 50 um (I-P) *P < 0.05, **P < 0.01, and ***P < 0.001.From: Clausen BH, Lambertsen KL, Babcock AA, Holm TH, Dagnaes-Hansen F, Finsen B. Interleukin-1beta and tumor necrosis factor-alpha are expressed by different subsets of microglia and macrophages after ischemic stroke in mice. J Neuroinflammation. 2008 Oct 23;5:46.)
Application Data
(Published customer image Infiltration of GFP+ BM-cells in infarct and peri-infarct regions. (A-B) Dot plots of viable macrophages/granulocytes (CD11b+CD45high, top right quadrants) and microglia (CD11b+CD45dim, bottom right quadrants) in cortex from BM-chimeric unmanipulated mice and mice exposed to pMCAO. (C) Bar graph showing mean numbers of CD11b+CD45dim microglia and CD11b+CD45high macrophages/granulocytes in BM-chimeric mice 24 hours after pMCAO, subdivided based on expression of GFP (n = 5). Approximately 92% of of the CD45high population were GFP+. (D) Estimation and comparison of mean numbers of CD11b+CD45dim microglia in non-chimeric (n = 10) versus BM-chimeric mice (n = 5) 24 hours after of pMCAO shows significantly fewer CD11b+CD45dim microglial cells in irradiated mice. (E) Overview, showing distribution of infiltrating GFP+ BM-derived cells into infarct (IF) and peri-infarct (P-IF) regions 24 hours after pMCAO. (E-G) By 24 hours, GFP+ single cells (F) and vessel-associated aggregates of GFP+ cells (arrows in G) were observed in infarct and peri-infarct regions. Some of the vessel-associated cells were round, leukocyte-like cells (arrows) while others were elongated cells lining the vasculature (arrow heads in G and in insert). (H) Bar graph showing mean numbers of single GFP+ cells and vessel-associated aggregates of GFP+ cells in ipsi- and contralateral cortex 24 hours after surgery (n = 10). (I-P) Immunohistochemical staining of CD45.1 (I, K), CD45.2 (J, L), IgG2a (M, O) and CD45 (N, P) in ischemic tissue in BM-chimeric (I, J, M, N) and non-chimeric mice (K, L, O, P) 24 hours after pMCAO. N.D, none detected. Scale bars: 200 um (A), 10 um (B, C). 50 um (I-P) *P < 0.05, **P < 0.01, and ***P < 0.001.From: Clausen BH, Lambertsen KL, Babcock AA, Holm TH, Dagnaes-Hansen F, Finsen B. Interleukin-1beta and tumor necrosis factor-alpha are expressed by different subsets of microglia and macrophages after ischemic stroke in mice. J Neuroinflammation. 2008 Oct 23;5:46.)
CD11b, Monoclonal Antibody (Cat# AAA12182)
Full Name
RAT ANTI MOUSE CD11b:FITC
Gene Names
Itgam; CR3; CR3A; MAC1; Cd11b; Ly-40; Mac-1; Mac-1a; CD11b/CD18; F730045J24Rik
Applications
Flow Cytometry
Pricing


 Application Data
(Published customer image Infiltration of GFP+ BM-cells in infarct and peri-infarct regions. (A-B) Dot plots of viable macrophages/granulocytes (CD11b+CD45high, top right quadrants) and microglia (CD11b+CD45dim, bottom right quadrants) in cortex from BM-chimeric unmanipulated mice and mice exposed to pMCAO. (C) Bar graph showing mean numbers of CD11b+CD45dim microglia and CD11b+CD45high macrophages/granulocytes in BM-chimeric mice 24 hours after pMCAO, subdivided based on expression of GFP (n = 5). Approximately 92% of of the CD45high population were GFP+. (D) Estimation and comparison of mean numbers of CD11b+CD45dim microglia in non-chimeric (n = 10) versus BM-chimeric mice (n = 5) 24 hours after of pMCAO shows significantly fewer CD11b+CD45dim microglial cells in irradiated mice. (E) Overview, showing distribution of infiltrating GFP+ BM-derived cells into infarct (IF) and peri-infarct (P-IF) regions 24 hours after pMCAO. (E-G) By 24 hours, GFP+ single cells (F) and vessel-associated aggregates of GFP+ cells (arrows in G) were observed in infarct and peri-infarct regions. Some of the vessel-associated cells were round, leukocyte-like cells (arrows) while others were elongated cells lining the vasculature (arrow heads in G and in insert). (H) Bar graph showing mean numbers of single GFP+ cells and vessel-associated aggregates of GFP+ cells in ipsi- and contralateral cortex 24 hours after surgery (n = 10). (I-P) Immunohistochemical staining of CD45.1 (I, K), CD45.2 (J, L), IgG2a (M, O) and CD45 (N, P) in ischemic tissue in BM-chimeric (I, J, M, N) and non-chimeric mice (K, L, O, P) 24 hours after pMCAO. N.D, none detected. Scale bars: 200 um (A), 10 um (B, C). 50 um (I-P) *P < 0.05, **P < 0.01, and ***P < 0.001.From: Clausen BH, Lambertsen KL, Babcock AA, Holm TH, Dagnaes-Hansen F, Finsen B. Interleukin-1beta and tumor necrosis factor-alpha are expressed by different subsets of microglia and macrophages after ischemic stroke in mice. J Neuroinflammation. 2008 Oct 23;5:46.)
Application Data
(Published customer image Infiltration of GFP+ BM-cells in infarct and peri-infarct regions. (A-B) Dot plots of viable macrophages/granulocytes (CD11b+CD45high, top right quadrants) and microglia (CD11b+CD45dim, bottom right quadrants) in cortex from BM-chimeric unmanipulated mice and mice exposed to pMCAO. (C) Bar graph showing mean numbers of CD11b+CD45dim microglia and CD11b+CD45high macrophages/granulocytes in BM-chimeric mice 24 hours after pMCAO, subdivided based on expression of GFP (n = 5). Approximately 92% of of the CD45high population were GFP+. (D) Estimation and comparison of mean numbers of CD11b+CD45dim microglia in non-chimeric (n = 10) versus BM-chimeric mice (n = 5) 24 hours after of pMCAO shows significantly fewer CD11b+CD45dim microglial cells in irradiated mice. (E) Overview, showing distribution of infiltrating GFP+ BM-derived cells into infarct (IF) and peri-infarct (P-IF) regions 24 hours after pMCAO. (E-G) By 24 hours, GFP+ single cells (F) and vessel-associated aggregates of GFP+ cells (arrows in G) were observed in infarct and peri-infarct regions. Some of the vessel-associated cells were round, leukocyte-like cells (arrows) while others were elongated cells lining the vasculature (arrow heads in G and in insert). (H) Bar graph showing mean numbers of single GFP+ cells and vessel-associated aggregates of GFP+ cells in ipsi- and contralateral cortex 24 hours after surgery (n = 10). (I-P) Immunohistochemical staining of CD45.1 (I, K), CD45.2 (J, L), IgG2a (M, O) and CD45 (N, P) in ischemic tissue in BM-chimeric (I, J, M, N) and non-chimeric mice (K, L, O, P) 24 hours after pMCAO. N.D, none detected. Scale bars: 200 um (A), 10 um (B, C). 50 um (I-P) *P < 0.05, **P < 0.01, and ***P < 0.001.From: Clausen BH, Lambertsen KL, Babcock AA, Holm TH, Dagnaes-Hansen F, Finsen B. Interleukin-1beta and tumor necrosis factor-alpha are expressed by different subsets of microglia and macrophages after ischemic stroke in mice. J Neuroinflammation. 2008 Oct 23;5:46.)
CD11b, Monoclonal Antibody (Cat# AAA12184)
Full Name
RAT ANTI MOUSE CD11b
Gene Names
Itgam; CR3; CR3A; MAC1; Cd11b; Ly-40; Mac-1; Mac-1a; CD11b/CD18; F730045J24Rik
Applications
Immunohistochemistry, Flow Cytometry, Immunofluorescence, Immunoprecipitation
Pricing


 Application Data
(Staining of mouse peritoneal macrophages with Rat anti Mouse CD11b)
Application Data
(Staining of mouse peritoneal macrophages with Rat anti Mouse CD11b)
CD11b, Monoclonal Antibody (Cat# AAA12219)
Full Name
RAT ANTI MOUSE CD11b:Low Endotoxin
Gene Names
Itgam; CR3; CR3A; MAC1; Cd11b; Ly-40; Mac-1; Mac-1a; CD11b/CD18; F730045J24Rik
Applications
Immunohistochemistry, Flow Cytometry, Functional Assay, Immunofluorescence, Immunoprecipitation, Immunohistochemistry
Pricing


 Application Data
(Published customer image: Increased accumulation of repair-associated macrophages surrounding collaterals in ischemic hind limbs is PAR2-dependent. (A) Stainings of CD206-positive macrophages (green) and SMA-positive vessels (red) in non-ischemic (control) and ischemic (ligated) hind limbs of WT, PAR1-/- and PAR2-/- mice are shown. Nuclei were visualized with DAPI (blue). Arrows indicate single macrophages in the non-ischemic adductor. Quantification of the average number of repair-associated macrophages per vessel is indicated on the right. (B) Correlation between the number of CD206-positive macrophages in the ischemic tissues and the expression of CD11b and (C) CD115 on monocytes. ** p)
Application Data
(Published customer image: Increased accumulation of repair-associated macrophages surrounding collaterals in ischemic hind limbs is PAR2-dependent. (A) Stainings of CD206-positive macrophages (green) and SMA-positive vessels (red) in non-ischemic (control) and ischemic (ligated) hind limbs of WT, PAR1-/- and PAR2-/- mice are shown. Nuclei were visualized with DAPI (blue). Arrows indicate single macrophages in the non-ischemic adductor. Quantification of the average number of repair-associated macrophages per vessel is indicated on the right. (B) Correlation between the number of CD206-positive macrophages in the ischemic tissues and the expression of CD11b and (C) CD115 on monocytes. ** p)
CD206, Monoclonal Antibody (Cat# AAA12123)
Full Name
RAT ANTI MOUSE CD206
Gene Names
Mrc1; MR; CD206; AW259686
Applications
Immunohistochemistry, Flow Cytometry, Immunofluorescence, Immunoprecipitation
Pricing


 Application Data
(Published customer image Infiltration of GFP+ BM-cells in infarct and peri-infarct regions. (A-B) Dot plots of viable macrophages/granulocytes (CD11b+CD45high, top right quadrants) and microglia (CD11b+CD45dim, bottom right quadrants) in cortex from BM-chimeric unmanipulated mice and mice exposed to pMCAO. (C) Bar graph showing mean numbers of CD11b+CD45dim microglia and CD11b+CD45high macrophages/granulocytes in BM-chimeric mice 24 hours after pMCAO, subdivided based on expression of GFP (n = 5). Approximately 92% of of the CD45high population were GFP+. (D) Estimation and comparison of mean numbers of CD11b+CD45dim microglia in non-chimeric (n = 10) versus BM-chimeric mice (n = 5) 24 hours after of pMCAO shows significantly fewer CD11b+CD45dim microglial cells in irradiated mice. (E) Overview, showing distribution of infiltrating GFP+ BM-derived cells into infarct (IF) and peri-infarct (P-IF) regions 24 hours after pMCAO. (E-G) By 24 hours, GFP+ single cells (F) and vessel-associated aggregates of GFP+ cells (arrows in G) were observed in infarct and peri-infarct regions. Some of the vessel-associated cells were round, leukocyte-like cells (arrows) while others were elongated cells lining the vasculature (arrow heads in G and in insert). (H) Bar graph showing mean numbers of single GFP+ cells and vessel-associated aggregates of GFP+ cells in ipsi- and contralateral cortex 24 hours after surgery (n = 10). (I-P) Immunohistochemical staining of CD45.1 (I, K), CD45.2 (J, L), IgG2a (M, O) and CD45 (N, P) in ischemic tissue in BM-chimeric (I, J, M, N) and non-chimeric mice (K, L, O, P) 24 hours after pMCAO. N.D, none detected. Scale bars: 200 um (A), 10 um (B, C). 50 um (I-P) *P < 0.05, **P < 0.01, and ***P < 0.001.From: Clausen BH, Lambertsen KL, Babcock AA, Holm TH, Dagnaes-Hansen F, Finsen B. Interleukin-1beta and tumor necrosis factor-alpha are expressed by different subsets of microglia and macrophages after ischemic stroke in mice. J Neuroinflammation. 2008 Oct 23;5:46.)
Application Data
(Published customer image Infiltration of GFP+ BM-cells in infarct and peri-infarct regions. (A-B) Dot plots of viable macrophages/granulocytes (CD11b+CD45high, top right quadrants) and microglia (CD11b+CD45dim, bottom right quadrants) in cortex from BM-chimeric unmanipulated mice and mice exposed to pMCAO. (C) Bar graph showing mean numbers of CD11b+CD45dim microglia and CD11b+CD45high macrophages/granulocytes in BM-chimeric mice 24 hours after pMCAO, subdivided based on expression of GFP (n = 5). Approximately 92% of of the CD45high population were GFP+. (D) Estimation and comparison of mean numbers of CD11b+CD45dim microglia in non-chimeric (n = 10) versus BM-chimeric mice (n = 5) 24 hours after of pMCAO shows significantly fewer CD11b+CD45dim microglial cells in irradiated mice. (E) Overview, showing distribution of infiltrating GFP+ BM-derived cells into infarct (IF) and peri-infarct (P-IF) regions 24 hours after pMCAO. (E-G) By 24 hours, GFP+ single cells (F) and vessel-associated aggregates of GFP+ cells (arrows in G) were observed in infarct and peri-infarct regions. Some of the vessel-associated cells were round, leukocyte-like cells (arrows) while others were elongated cells lining the vasculature (arrow heads in G and in insert). (H) Bar graph showing mean numbers of single GFP+ cells and vessel-associated aggregates of GFP+ cells in ipsi- and contralateral cortex 24 hours after surgery (n = 10). (I-P) Immunohistochemical staining of CD45.1 (I, K), CD45.2 (J, L), IgG2a (M, O) and CD45 (N, P) in ischemic tissue in BM-chimeric (I, J, M, N) and non-chimeric mice (K, L, O, P) 24 hours after pMCAO. N.D, none detected. Scale bars: 200 um (A), 10 um (B, C). 50 um (I-P) *P < 0.05, **P < 0.01, and ***P < 0.001.From: Clausen BH, Lambertsen KL, Babcock AA, Holm TH, Dagnaes-Hansen F, Finsen B. Interleukin-1beta and tumor necrosis factor-alpha are expressed by different subsets of microglia and macrophages after ischemic stroke in mice. J Neuroinflammation. 2008 Oct 23;5:46.)
CD11b, Monoclonal Antibody (Cat# AAA12183)
Full Name
RAT ANTI MOUSE CD11b:FITC
Gene Names
Itgam; CR3; CR3A; MAC1; Cd11b; Ly-40; Mac-1; Mac-1a; CD11b/CD18; F730045J24Rik
Applications
Flow Cytometry
Pricing


 Application Data
(Published customer image Infiltration of GFP+ BM-cells in infarct and peri-infarct regions. (A-B) Dot plots of viable macrophages/granulocytes (CD11b+CD45high, top right quadrants) and microglia (CD11b+CD45dim, bottom right quadrants) in cortex from BM-chimeric unmanipulated mice and mice exposed to pMCAO. (C) Bar graph showing mean numbers of CD11b+CD45dim microglia and CD11b+CD45high macrophages/granulocytes in BM-chimeric mice 24 hours after pMCAO, subdivided based on expression of GFP (n = 5). Approximately 92% of of the CD45high population were GFP+. (D) Estimation and comparison of mean numbers of CD11b+CD45dim microglia in non-chimeric (n = 10) versus BM-chimeric mice (n = 5) 24 hours after of pMCAO shows significantly fewer CD11b+CD45dim microglial cells in irradiated mice. (E) Overview, showing distribution of infiltrating GFP+ BM-derived cells into infarct (IF) and peri-infarct (P-IF) regions 24 hours after pMCAO. (E-G) By 24 hours, GFP+ single cells (F) and vessel-associated aggregates of GFP+ cells (arrows in G) were observed in infarct and peri-infarct regions. Some of the vessel-associated cells were round, leukocyte-like cells (arrows) while others were elongated cells lining the vasculature (arrow heads in G and in insert). (H) Bar graph showing mean numbers of single GFP+ cells and vessel-associated aggregates of GFP+ cells in ipsi- and contralateral cortex 24 hours after surgery (n = 10). (I-P) Immunohistochemical staining of CD45.1 (I, K), CD45.2 (J, L), IgG2a (M, O) and CD45 (N, P) in ischemic tissue in BM-chimeric (I, J, M, N) and non-chimeric mice (K, L, O, P) 24 hours after pMCAO. N.D, none detected. Scale bars: 200 um (A), 10 um (B, C). 50 um (I-P) *P < 0.05, **P < 0.01, and ***P < 0.001.From: Clausen BH, Lambertsen KL, Babcock AA, Holm TH, Dagnaes-Hansen F, Finsen B. Interleukin-1beta and tumor necrosis factor-alpha are expressed by different subsets of microglia and macrophages after ischemic stroke in mice. J Neuroinflammation. 2008 Oct 23;5:46.)
Application Data
(Published customer image Infiltration of GFP+ BM-cells in infarct and peri-infarct regions. (A-B) Dot plots of viable macrophages/granulocytes (CD11b+CD45high, top right quadrants) and microglia (CD11b+CD45dim, bottom right quadrants) in cortex from BM-chimeric unmanipulated mice and mice exposed to pMCAO. (C) Bar graph showing mean numbers of CD11b+CD45dim microglia and CD11b+CD45high macrophages/granulocytes in BM-chimeric mice 24 hours after pMCAO, subdivided based on expression of GFP (n = 5). Approximately 92% of of the CD45high population were GFP+. (D) Estimation and comparison of mean numbers of CD11b+CD45dim microglia in non-chimeric (n = 10) versus BM-chimeric mice (n = 5) 24 hours after of pMCAO shows significantly fewer CD11b+CD45dim microglial cells in irradiated mice. (E) Overview, showing distribution of infiltrating GFP+ BM-derived cells into infarct (IF) and peri-infarct (P-IF) regions 24 hours after pMCAO. (E-G) By 24 hours, GFP+ single cells (F) and vessel-associated aggregates of GFP+ cells (arrows in G) were observed in infarct and peri-infarct regions. Some of the vessel-associated cells were round, leukocyte-like cells (arrows) while others were elongated cells lining the vasculature (arrow heads in G and in insert). (H) Bar graph showing mean numbers of single GFP+ cells and vessel-associated aggregates of GFP+ cells in ipsi- and contralateral cortex 24 hours after surgery (n = 10). (I-P) Immunohistochemical staining of CD45.1 (I, K), CD45.2 (J, L), IgG2a (M, O) and CD45 (N, P) in ischemic tissue in BM-chimeric (I, J, M, N) and non-chimeric mice (K, L, O, P) 24 hours after pMCAO. N.D, none detected. Scale bars: 200 um (A), 10 um (B, C). 50 um (I-P) *P < 0.05, **P < 0.01, and ***P < 0.001.From: Clausen BH, Lambertsen KL, Babcock AA, Holm TH, Dagnaes-Hansen F, Finsen B. Interleukin-1beta and tumor necrosis factor-alpha are expressed by different subsets of microglia and macrophages after ischemic stroke in mice. J Neuroinflammation. 2008 Oct 23;5:46.)
CD11b, Monoclonal Antibody (Cat# AAA12185)
Full Name
RAT ANTI MOUSE CD11b
Gene Names
Itgam; CR3; CR3A; MAC1; Cd11b; Ly-40; Mac-1; Mac-1a; CD11b/CD18; F730045J24Rik
Applications
Immunohistochemistry, Flow Cytometry, Immunofluorescence, Immunoprecipitation
Pricing


 Application Data
(Staining of mouse peritoneal macrophages with Rat anti Mouse CD11b)
Application Data
(Staining of mouse peritoneal macrophages with Rat anti Mouse CD11b)
CD11b, Monoclonal Antibody (Cat# AAA12187)
Full Name
RAT ANTI MOUSE CD11b:Biotin
Gene Names
Itgam; CR3; CR3A; MAC1; Cd11b; Ly-40; Mac-1; Mac-1a; CD11b/CD18; F730045J24Rik
Applications
Flow Cytometry
Pricing


 Application Data
(Published customer image: Increased accumulation of repair-associated macrophages surrounding collaterals in ischemic hind limbs is PAR2-dependent. (A) Stainings of CD206-positive macrophages (green) and SMA-positive vessels (red) in non-ischemic (control) and ischemic (ligated) hind limbs of WT, PAR1-/- and PAR2-/- mice are shown. Nuclei were visualized with DAPI (blue). Arrows indicate single macrophages in the non-ischemic adductor. Quantification of the average number of repair-associated macrophages per vessel is indicated on the right. (B) Correlation between the number of CD206-positive macrophages in the ischemic tissues and the expression of CD11b and (C) CD115 on monocytes. ** p)
Application Data
(Published customer image: Increased accumulation of repair-associated macrophages surrounding collaterals in ischemic hind limbs is PAR2-dependent. (A) Stainings of CD206-positive macrophages (green) and SMA-positive vessels (red) in non-ischemic (control) and ischemic (ligated) hind limbs of WT, PAR1-/- and PAR2-/- mice are shown. Nuclei were visualized with DAPI (blue). Arrows indicate single macrophages in the non-ischemic adductor. Quantification of the average number of repair-associated macrophages per vessel is indicated on the right. (B) Correlation between the number of CD206-positive macrophages in the ischemic tissues and the expression of CD11b and (C) CD115 on monocytes. ** p)
CD206, Monoclonal Antibody (Cat# AAA12118)
Full Name
RAT ANTI MOUSE CD206:Biotin
Gene Names
Mrc1; MR; CD206; AW259686
Applications
Flow Cytometry
Pricing


 Application Data
(Published customer image: Increased accumulation of repair-associated macrophages surrounding collaterals in ischemic hind limbs is PAR2-dependent. (A) Stainings of CD206-positive macrophages (green) and SMA-positive vessels (red) in non-ischemic (control) and ischemic (ligated) hind limbs of WT, PAR1-/- and PAR2-/- mice are shown. Nuclei were visualized with DAPI (blue). Arrows indicate single macrophages in the non-ischemic adductor. Quantification of the average number of repair-associated macrophages per vessel is indicated on the right. (B) Correlation between the number of CD206-positive macrophages in the ischemic tissues and the expression of CD11b and (C) CD115 on monocytes. ** p)
Application Data
(Published customer image: Increased accumulation of repair-associated macrophages surrounding collaterals in ischemic hind limbs is PAR2-dependent. (A) Stainings of CD206-positive macrophages (green) and SMA-positive vessels (red) in non-ischemic (control) and ischemic (ligated) hind limbs of WT, PAR1-/- and PAR2-/- mice are shown. Nuclei were visualized with DAPI (blue). Arrows indicate single macrophages in the non-ischemic adductor. Quantification of the average number of repair-associated macrophages per vessel is indicated on the right. (B) Correlation between the number of CD206-positive macrophages in the ischemic tissues and the expression of CD11b and (C) CD115 on monocytes. ** p)
CD206, Monoclonal Antibody (Cat# AAA12124)
Full Name
RAT ANTI MOUSE CD206:RPE
Gene Names
Mrc1; MR; CD206; AW259686
Applications
Flow Cytometry
Pricing


 Application Data
(Published customer image Infiltration of GFP+ BM-cells in infarct and peri-infarct regions. (A-B) Dot plots of viable macrophages/granulocytes (CD11b+CD45high, top right quadrants) and microglia (CD11b+CD45dim, bottom right quadrants) in cortex from BM-chimeric unmanipulated mice and mice exposed to pMCAO. (C) Bar graph showing mean numbers of CD11b+CD45dim microglia and CD11b+CD45high macrophages/granulocytes in BM-chimeric mice 24 hours after pMCAO, subdivided based on expression of GFP (n = 5). Approximately 92% of of the CD45high population were GFP+. (D) Estimation and comparison of mean numbers of CD11b+CD45dim microglia in non-chimeric (n = 10) versus BM-chimeric mice (n = 5) 24 hours after of pMCAO shows significantly fewer CD11b+CD45dim microglial cells in irradiated mice. (E) Overview, showing distribution of infiltrating GFP+ BM-derived cells into infarct (IF) and peri-infarct (P-IF) regions 24 hours after pMCAO. (E-G) By 24 hours, GFP+ single cells (F) and vessel-associated aggregates of GFP+ cells (arrows in G) were observed in infarct and peri-infarct regions. Some of the vessel-associated cells were round, leukocyte-like cells (arrows) while others were elongated cells lining the vasculature (arrow heads in G and in insert). (H) Bar graph showing mean numbers of single GFP+ cells and vessel-associated aggregates of GFP+ cells in ipsi- and contralateral cortex 24 hours after surgery (n = 10). (I-P) Immunohistochemical staining of CD45.1 (I, K), CD45.2 (J, L), IgG2a (M, O) and CD45 (N, P) in ischemic tissue in BM-chimeric (I, J, M, N) and non-chimeric mice (K, L, O, P) 24 hours after pMCAO. N.D, none detected. Scale bars: 200 um (A), 10 um (B, C). 50 um (I-P) *P < 0.05, **P < 0.01, and ***P < 0.001.From: Clausen BH, Lambertsen KL, Babcock AA, Holm TH, Dagnaes-Hansen F, Finsen B. Interleukin-1beta and tumor necrosis factor-alpha are expressed by different subsets of microglia and macrophages after ischemic stroke in mice. J Neuroinflammation. 2008 Oct 23;5:46.)
Application Data
(Published customer image Infiltration of GFP+ BM-cells in infarct and peri-infarct regions. (A-B) Dot plots of viable macrophages/granulocytes (CD11b+CD45high, top right quadrants) and microglia (CD11b+CD45dim, bottom right quadrants) in cortex from BM-chimeric unmanipulated mice and mice exposed to pMCAO. (C) Bar graph showing mean numbers of CD11b+CD45dim microglia and CD11b+CD45high macrophages/granulocytes in BM-chimeric mice 24 hours after pMCAO, subdivided based on expression of GFP (n = 5). Approximately 92% of of the CD45high population were GFP+. (D) Estimation and comparison of mean numbers of CD11b+CD45dim microglia in non-chimeric (n = 10) versus BM-chimeric mice (n = 5) 24 hours after of pMCAO shows significantly fewer CD11b+CD45dim microglial cells in irradiated mice. (E) Overview, showing distribution of infiltrating GFP+ BM-derived cells into infarct (IF) and peri-infarct (P-IF) regions 24 hours after pMCAO. (E-G) By 24 hours, GFP+ single cells (F) and vessel-associated aggregates of GFP+ cells (arrows in G) were observed in infarct and peri-infarct regions. Some of the vessel-associated cells were round, leukocyte-like cells (arrows) while others were elongated cells lining the vasculature (arrow heads in G and in insert). (H) Bar graph showing mean numbers of single GFP+ cells and vessel-associated aggregates of GFP+ cells in ipsi- and contralateral cortex 24 hours after surgery (n = 10). (I-P) Immunohistochemical staining of CD45.1 (I, K), CD45.2 (J, L), IgG2a (M, O) and CD45 (N, P) in ischemic tissue in BM-chimeric (I, J, M, N) and non-chimeric mice (K, L, O, P) 24 hours after pMCAO. N.D, none detected. Scale bars: 200 um (A), 10 um (B, C). 50 um (I-P) *P < 0.05, **P < 0.01, and ***P < 0.001.From: Clausen BH, Lambertsen KL, Babcock AA, Holm TH, Dagnaes-Hansen F, Finsen B. Interleukin-1beta and tumor necrosis factor-alpha are expressed by different subsets of microglia and macrophages after ischemic stroke in mice. J Neuroinflammation. 2008 Oct 23;5:46.)
CD11b, Monoclonal Antibody (Cat# AAA12186)
Full Name
RAT ANTI MOUSE CD11b:RPE
Gene Names
Itgam; CR3; CR3A; MAC1; Cd11b; Ly-40; Mac-1; Mac-1a; CD11b/CD18; F730045J24Rik
Applications
Flow Cytometry
Pricing


 Application Data
(Published customer image Infiltration of GFP+ BM-cells in infarct and peri-infarct regions. (A-B) Dot plots of viable macrophages/granulocytes (CD11b+CD45high, top right quadrants) and microglia (CD11b+CD45dim, bottom right quadrants) in cortex from BM-chimeric unmanipulated mice and mice exposed to pMCAO. (C) Bar graph showing mean numbers of CD11b+CD45dim microglia and CD11b+CD45high macrophages/granulocytes in BM-chimeric mice 24 hours after pMCAO, subdivided based on expression of GFP (n = 5). Approximately 92% of of the CD45high population were GFP+. (D) Estimation and comparison of mean numbers of CD11b+CD45dim microglia in non-chimeric (n = 10) versus BM-chimeric mice (n = 5) 24 hours after of pMCAO shows significantly fewer CD11b+CD45dim microglial cells in irradiated mice. (E) Overview, showing distribution of infiltrating GFP+ BM-derived cells into infarct (IF) and peri-infarct (P-IF) regions 24 hours after pMCAO. (E-G) By 24 hours, GFP+ single cells (F) and vessel-associated aggregates of GFP+ cells (arrows in G) were observed in infarct and peri-infarct regions. Some of the vessel-associated cells were round, leukocyte-like cells (arrows) while others were elongated cells lining the vasculature (arrow heads in G and in insert). (H) Bar graph showing mean numbers of single GFP+ cells and vessel-associated aggregates of GFP+ cells in ipsi- and contralateral cortex 24 hours after surgery (n = 10). (I-P) Immunohistochemical staining of CD45.1 (I, K), CD45.2 (J, L), IgG2a (M, O) and CD45 (N, P) in ischemic tissue in BM-chimeric (I, J, M, N) and non-chimeric mice (K, L, O, P) 24 hours after pMCAO. N.D, none detected. Scale bars: 200 um (A), 10 um (B, C). 50 um (I-P) *P < 0.05, **P < 0.01, and ***P < 0.001.From: Clausen BH, Lambertsen KL, Babcock AA, Holm TH, Dagnaes-Hansen F, Finsen B. Interleukin-1beta and tumor necrosis factor-alpha are expressed by different subsets of microglia and macrophages after ischemic stroke in mice. J Neuroinflammation. 2008 Oct 23;5:46.)
Application Data
(Published customer image Infiltration of GFP+ BM-cells in infarct and peri-infarct regions. (A-B) Dot plots of viable macrophages/granulocytes (CD11b+CD45high, top right quadrants) and microglia (CD11b+CD45dim, bottom right quadrants) in cortex from BM-chimeric unmanipulated mice and mice exposed to pMCAO. (C) Bar graph showing mean numbers of CD11b+CD45dim microglia and CD11b+CD45high macrophages/granulocytes in BM-chimeric mice 24 hours after pMCAO, subdivided based on expression of GFP (n = 5). Approximately 92% of of the CD45high population were GFP+. (D) Estimation and comparison of mean numbers of CD11b+CD45dim microglia in non-chimeric (n = 10) versus BM-chimeric mice (n = 5) 24 hours after of pMCAO shows significantly fewer CD11b+CD45dim microglial cells in irradiated mice. (E) Overview, showing distribution of infiltrating GFP+ BM-derived cells into infarct (IF) and peri-infarct (P-IF) regions 24 hours after pMCAO. (E-G) By 24 hours, GFP+ single cells (F) and vessel-associated aggregates of GFP+ cells (arrows in G) were observed in infarct and peri-infarct regions. Some of the vessel-associated cells were round, leukocyte-like cells (arrows) while others were elongated cells lining the vasculature (arrow heads in G and in insert). (H) Bar graph showing mean numbers of single GFP+ cells and vessel-associated aggregates of GFP+ cells in ipsi- and contralateral cortex 24 hours after surgery (n = 10). (I-P) Immunohistochemical staining of CD45.1 (I, K), CD45.2 (J, L), IgG2a (M, O) and CD45 (N, P) in ischemic tissue in BM-chimeric (I, J, M, N) and non-chimeric mice (K, L, O, P) 24 hours after pMCAO. N.D, none detected. Scale bars: 200 um (A), 10 um (B, C). 50 um (I-P) *P < 0.05, **P < 0.01, and ***P < 0.001.From: Clausen BH, Lambertsen KL, Babcock AA, Holm TH, Dagnaes-Hansen F, Finsen B. Interleukin-1beta and tumor necrosis factor-alpha are expressed by different subsets of microglia and macrophages after ischemic stroke in mice. J Neuroinflammation. 2008 Oct 23;5:46.)
CD11b, Monoclonal Antibody (Cat# AAA12231)
Full Name
RAT ANTI MOUSE CD11b:Low Endotoxin
Gene Names
Itgam; CR3; CR3A; MAC1; Cd11b; Ly-40; Mac-1; Mac-1a; CD11b/CD18; F730045J24Rik
Applications
Immunohistochemistry, Flow Cytometry, Functional Assay, Immunofluorescence, Immunoprecipitation
Pricing


 Application Data
(Published customer image Infiltration of GFP+ BM-cells in infarct and peri-infarct regions. (A-B) Dot plots of viable macrophages/granulocytes (CD11b+CD45high, top right quadrants) and microglia (CD11b+CD45dim, bottom right quadrants) in cortex from BM-chimeric unmanipulated mice and mice exposed to pMCAO. (C) Bar graph showing mean numbers of CD11b+CD45dim microglia and CD11b+CD45high macrophages/granulocytes in BM-chimeric mice 24 hours after pMCAO, subdivided based on expression of GFP (n = 5). Approximately 92% of of the CD45high population were GFP+. (D) Estimation and comparison of mean numbers of CD11b+CD45dim microglia in non-chimeric (n = 10) versus BM-chimeric mice (n = 5) 24 hours after of pMCAO shows significantly fewer CD11b+CD45dim microglial cells in irradiated mice. (E) Overview, showing distribution of infiltrating GFP+ BM-derived cells into infarct (IF) and peri-infarct (P-IF) regions 24 hours after pMCAO. (E-G) By 24 hours, GFP+ single cells (F) and vessel-associated aggregates of GFP+ cells (arrows in G) were observed in infarct and peri-infarct regions. Some of the vessel-associated cells were round, leukocyte-like cells (arrows) while others were elongated cells lining the vasculature (arrow heads in G and in insert). (H) Bar graph showing mean numbers of single GFP+ cells and vessel-associated aggregates of GFP+ cells in ipsi- and contralateral cortex 24 hours after surgery (n = 10). (I-P) Immunohistochemical staining of CD45.1 (I, K), CD45.2 (J, L), IgG2a (M, O) and CD45 (N, P) in ischemic tissue in BM-chimeric (I, J, M, N) and non-chimeric mice (K, L, O, P) 24 hours after pMCAO. N.D, none detected. Scale bars: 200 um (A), 10 um (B, C). 50 um (I-P) *P < 0.05, **P < 0.01, and ***P < 0.001.From: Clausen BH, Lambertsen KL, Babcock AA, Holm TH, Dagnaes-Hansen F, Finsen B. Interleukin-1beta and tumor necrosis factor-alpha are expressed by different subsets of microglia and macrophages after ischemic stroke in mice. J Neuroinflammation. 2008 Oct 23;5:46.)
Application Data
(Published customer image Infiltration of GFP+ BM-cells in infarct and peri-infarct regions. (A-B) Dot plots of viable macrophages/granulocytes (CD11b+CD45high, top right quadrants) and microglia (CD11b+CD45dim, bottom right quadrants) in cortex from BM-chimeric unmanipulated mice and mice exposed to pMCAO. (C) Bar graph showing mean numbers of CD11b+CD45dim microglia and CD11b+CD45high macrophages/granulocytes in BM-chimeric mice 24 hours after pMCAO, subdivided based on expression of GFP (n = 5). Approximately 92% of of the CD45high population were GFP+. (D) Estimation and comparison of mean numbers of CD11b+CD45dim microglia in non-chimeric (n = 10) versus BM-chimeric mice (n = 5) 24 hours after of pMCAO shows significantly fewer CD11b+CD45dim microglial cells in irradiated mice. (E) Overview, showing distribution of infiltrating GFP+ BM-derived cells into infarct (IF) and peri-infarct (P-IF) regions 24 hours after pMCAO. (E-G) By 24 hours, GFP+ single cells (F) and vessel-associated aggregates of GFP+ cells (arrows in G) were observed in infarct and peri-infarct regions. Some of the vessel-associated cells were round, leukocyte-like cells (arrows) while others were elongated cells lining the vasculature (arrow heads in G and in insert). (H) Bar graph showing mean numbers of single GFP+ cells and vessel-associated aggregates of GFP+ cells in ipsi- and contralateral cortex 24 hours after surgery (n = 10). (I-P) Immunohistochemical staining of CD45.1 (I, K), CD45.2 (J, L), IgG2a (M, O) and CD45 (N, P) in ischemic tissue in BM-chimeric (I, J, M, N) and non-chimeric mice (K, L, O, P) 24 hours after pMCAO. N.D, none detected. Scale bars: 200 um (A), 10 um (B, C). 50 um (I-P) *P < 0.05, **P < 0.01, and ***P < 0.001.From: Clausen BH, Lambertsen KL, Babcock AA, Holm TH, Dagnaes-Hansen F, Finsen B. Interleukin-1beta and tumor necrosis factor-alpha are expressed by different subsets of microglia and macrophages after ischemic stroke in mice. J Neuroinflammation. 2008 Oct 23;5:46.)
CD11b, Monoclonal Antibody (Cat# AAA12181)
Full Name
RAT ANTI MOUSE CD11b
Gene Names
Itgam; CR3; CR3A; MAC1; Cd11b; Ly-40; Mac-1; Mac-1a; CD11b/CD18; F730045J24Rik
Reactivity
Human
Applications
Immunohistochemistry, Flow Cytometry, Immunofluorescence, Immunoprecipitation
Pricing


 Application Data
(Published customer image: Increased accumulation of repair-associated macrophages surrounding collaterals in ischemic hind limbs is PAR2-dependent. (A) Stainings of CD206-positive macrophages (green) and SMA-positive vessels (red) in non-ischemic (control) and ischemic (ligated) hind limbs of WT, PAR1-/- and PAR2-/- mice are shown. Nuclei were visualized with DAPI (blue). Arrows indicate single macrophages in the non-ischemic adductor. Quantification of the average number of repair-associated macrophages per vessel is indicated on the right. (B) Correlation between the number of CD206-positive macrophages in the ischemic tissues and the expression of CD11b and (C) CD115 on monocytes. ** p)
Application Data
(Published customer image: Increased accumulation of repair-associated macrophages surrounding collaterals in ischemic hind limbs is PAR2-dependent. (A) Stainings of CD206-positive macrophages (green) and SMA-positive vessels (red) in non-ischemic (control) and ischemic (ligated) hind limbs of WT, PAR1-/- and PAR2-/- mice are shown. Nuclei were visualized with DAPI (blue). Arrows indicate single macrophages in the non-ischemic adductor. Quantification of the average number of repair-associated macrophages per vessel is indicated on the right. (B) Correlation between the number of CD206-positive macrophages in the ischemic tissues and the expression of CD11b and (C) CD115 on monocytes. ** p)
CD206, Monoclonal Antibody (Cat# AAA12119)
Full Name
RAT ANTI MOUSE CD206:FITC
Gene Names
Mrc1; MR; CD206; AW259686
Applications
Flow Cytometry
Pricing


 Application Data
(Published customer image: Increased accumulation of repair-associated macrophages surrounding collaterals in ischemic hind limbs is PAR2-dependent. (A) Stainings of CD206-positive macrophages (green) and SMA-positive vessels (red) in non-ischemic (control) and ischemic (ligated) hind limbs of WT, PAR1-/- and PAR2-/- mice are shown. Nuclei were visualized with DAPI (blue). Arrows indicate single macrophages in the non-ischemic adductor. Quantification of the average number of repair-associated macrophages per vessel is indicated on the right. (B) Correlation between the number of CD206-positive macrophages in the ischemic tissues and the expression of CD11b and (C) CD115 on monocytes. ** p)
Application Data
(Published customer image: Increased accumulation of repair-associated macrophages surrounding collaterals in ischemic hind limbs is PAR2-dependent. (A) Stainings of CD206-positive macrophages (green) and SMA-positive vessels (red) in non-ischemic (control) and ischemic (ligated) hind limbs of WT, PAR1-/- and PAR2-/- mice are shown. Nuclei were visualized with DAPI (blue). Arrows indicate single macrophages in the non-ischemic adductor. Quantification of the average number of repair-associated macrophages per vessel is indicated on the right. (B) Correlation between the number of CD206-positive macrophages in the ischemic tissues and the expression of CD11b and (C) CD115 on monocytes. ** p)
CD206, Monoclonal Antibody (Cat# AAA12121)
Full Name
RAT ANTI MOUSE CD206:FITC
Gene Names
Mrc1; MR; CD206; AW259686
Applications
Flow Cytometry
Pricing


 Application Data
(Staining of mouse peritoneal macrophages with Rat anti Mouse CD11b)
Application Data
(Staining of mouse peritoneal macrophages with Rat anti Mouse CD11b)
CD11b, Monoclonal Antibody (Cat# AAA12008)
Full Name
RAT ANTI MOUSE CD11b
Gene Names
Itgam; CR3; CR3A; MAC1; Cd11b; Ly-40; Mac-1; Mac-1a; CD11b/CD18; F730045J24Rik
Applications
Immunohistochemistry, Flow Cytometry, Immunofluorescence, Immunoprecipitation, Immunohistochemistry
Pricing


 Application Data
(Staining of mouse peritoneal macrophages with Rat anti Mouse CD11b)
Application Data
(Staining of mouse peritoneal macrophages with Rat anti Mouse CD11b)
CD11b, Monoclonal Antibody (Cat# AAA12007)
Full Name
RAT ANTI MOUSE CD11b
Gene Names
Itgam; CR3; CR3A; MAC1; Cd11b; Ly-40; Mac-1; Mac-1a; CD11b/CD18; F730045J24Rik
Applications
Immunohistochemistry, Flow Cytometry, Immunofluorescence, Immunoprecipitation, Immunohistochemistry
Pricing
CD200R, Monoclonal Antibody (Cat# AAA27746)
Full Name
Recombinant Anti-CD200R Antibody, Rabbit Monoclonal
Gene Names
CD200R1; OX2R; MOX2R; CD200R; HCRTR2
Reactivity
Human
Applications
ELISA
Purity
Protein A
Pricing
 Application Data
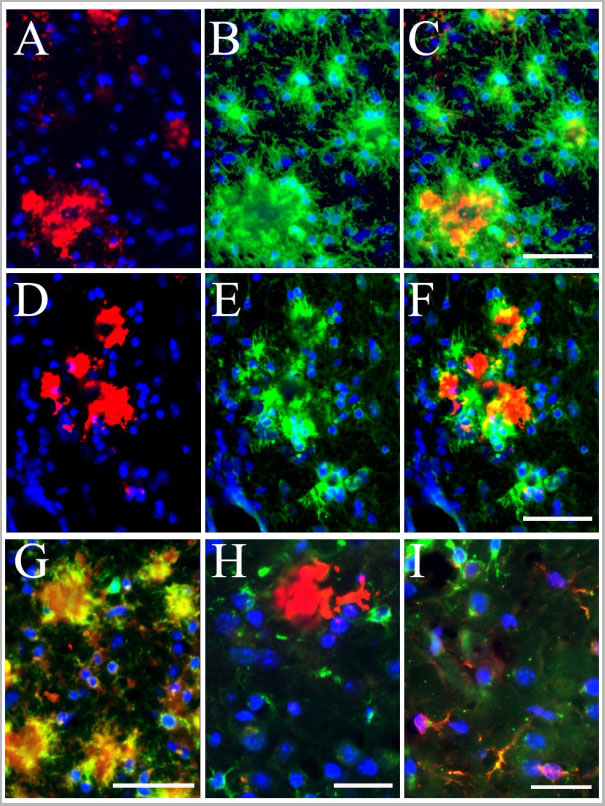
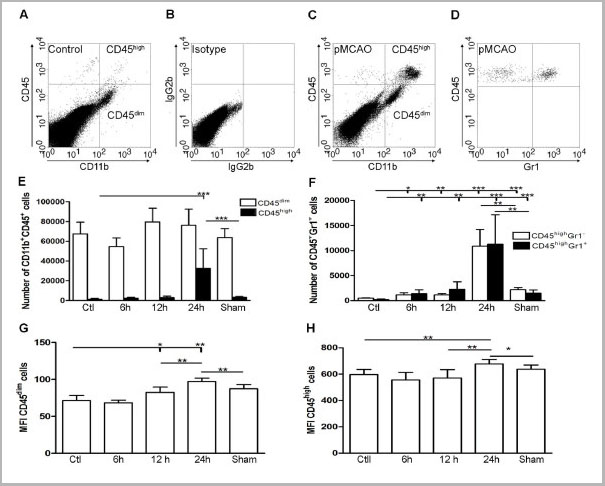
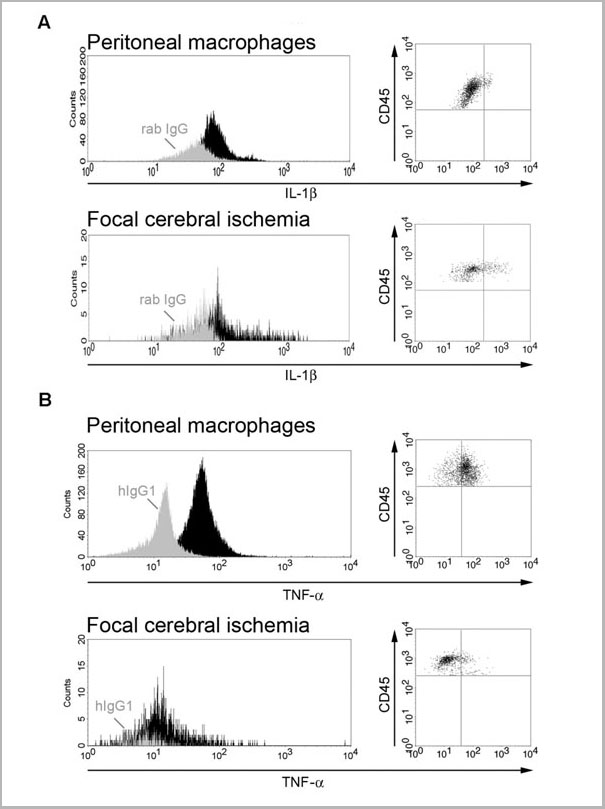
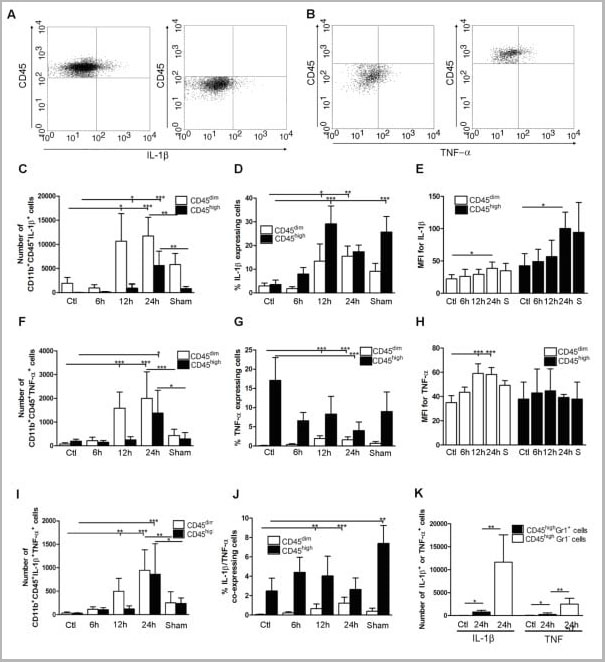
(Published customer image: Cytokine expression in segregated populations of cells following stroke. (A, B) Dot plots showing CD11b+CD45high macrophages/granulocytes (upper right quadrants) and CD11b+CD45dim microglia (bottom right quadrants) expressing IL-1beta (A) or TNF-a (B). (C-J) Bar graphs showing numbers and proportions of IL-1beta (C, D), TNF-a (F, G) and IL-1beta/TNF-a co-expressing (I, J) CD11b+CD45dim microglia and CD11b+CD45high macrophages/granulocytes in unmanipulated control mice (n = 10), in mice 6 (n = 7), 12 (n = 7), or 24 hours after pMCAO (n = 10), and in sham-operated mice 24 hours after pMCAO (n = 7). (E, H) Comparison of the MFI values for IL-1beta (E) and TNF-a (H) in viable CD11b+CD45dim microglia and CD11b+CD45high macrophages/granulocytes in unmanipulated mice, in mice 6, 12, or 24 hours after pMCAO, and in sham-operated mice 24 hours after pMCAO. Macrophages/granulocytes express significantly more IL-1beta than do microglial in unmanipulated mice, in mice 6, 12, or 24 hours after pMCAO, and in sham-operated mice 24 hours after pMCAO (E), whereas microglial cells express significantly higher levels of TNF-a than do macrophages/granulocytes at 12 h and 24 hours, and in sham-operated mice 24 hours after pMCAO (H). (K) CD11b+CD45highGr1- macrophages and not CD11b+CD45highGr1+ granulocytes are the main producers of IL-1beta and TNF-a 24 hours after pMCAO. *P < 0.05, **P < 0.01, and ***P < 0.001.From: http://www.jneuroinflammation.com/content/5/1/46.)
Application Data
(Published customer image: Cytokine expression in segregated populations of cells following stroke. (A, B) Dot plots showing CD11b+CD45high macrophages/granulocytes (upper right quadrants) and CD11b+CD45dim microglia (bottom right quadrants) expressing IL-1beta (A) or TNF-a (B). (C-J) Bar graphs showing numbers and proportions of IL-1beta (C, D), TNF-a (F, G) and IL-1beta/TNF-a co-expressing (I, J) CD11b+CD45dim microglia and CD11b+CD45high macrophages/granulocytes in unmanipulated control mice (n = 10), in mice 6 (n = 7), 12 (n = 7), or 24 hours after pMCAO (n = 10), and in sham-operated mice 24 hours after pMCAO (n = 7). (E, H) Comparison of the MFI values for IL-1beta (E) and TNF-a (H) in viable CD11b+CD45dim microglia and CD11b+CD45high macrophages/granulocytes in unmanipulated mice, in mice 6, 12, or 24 hours after pMCAO, and in sham-operated mice 24 hours after pMCAO. Macrophages/granulocytes express significantly more IL-1beta than do microglial in unmanipulated mice, in mice 6, 12, or 24 hours after pMCAO, and in sham-operated mice 24 hours after pMCAO (E), whereas microglial cells express significantly higher levels of TNF-a than do macrophages/granulocytes at 12 h and 24 hours, and in sham-operated mice 24 hours after pMCAO (H). (K) CD11b+CD45highGr1- macrophages and not CD11b+CD45highGr1+ granulocytes are the main producers of IL-1beta and TNF-a 24 hours after pMCAO. *P < 0.05, **P < 0.01, and ***P < 0.001.From: http://www.jneuroinflammation.com/content/5/1/46.)
CD45, Monoclonal Antibody (Cat# AAA11896)
Full Name
RAT ANTI MOUSE CD45
Gene Names
Ptprc; loc; B220; Cd45; L-CA; Ly-5; T200; CD45R; Lyt-4
Applications
Immunohistochemistry, Flow Cytometry, Immunofluorescence, Immunoprecipitation
Pricing
 Application Data
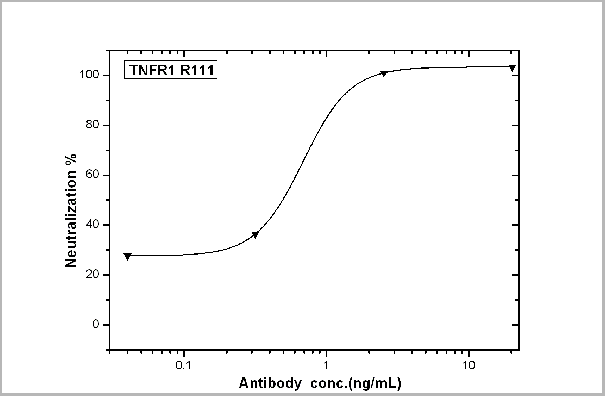
(TNFR1/TNFRSF1A-mediated inhibition of cytotoxicity was Neutralized by Human TNFR1 Antibody. Recombinant Human TNFR1/TNFRSF1A inhibits Recombinant Human TNFa induced cytotoxicity in the L-929 mouse fibroblast cell line. Inhibition of Recombinant Human TNFa (0.2 ng/mL) activity elicited by Recombinant Human TNFR1/TNFRSF1A (0.3 ug/mL) is neutralized by increasing concentrations of Human TNFR1/TNFRSF1A Monoclonal Antibody. The IC50 is typically 0.5-1.5 ug/mL in the presence of the metabolic inhibitor actinomycin D (1 ug/mL).)
Application Data
(TNFR1/TNFRSF1A-mediated inhibition of cytotoxicity was Neutralized by Human TNFR1 Antibody. Recombinant Human TNFR1/TNFRSF1A inhibits Recombinant Human TNFa induced cytotoxicity in the L-929 mouse fibroblast cell line. Inhibition of Recombinant Human TNFa (0.2 ng/mL) activity elicited by Recombinant Human TNFR1/TNFRSF1A (0.3 ug/mL) is neutralized by increasing concentrations of Human TNFR1/TNFRSF1A Monoclonal Antibody. The IC50 is typically 0.5-1.5 ug/mL in the presence of the metabolic inhibitor actinomycin D (1 ug/mL).)
TNFR1/CD120a/TNFRSF1A, Monoclonal Antibody (Cat# AAA27740)
Full Name
TNFR1/CD120a/TNFRSF1A Neutralizing Antibody
Gene Names
TNFRSF1A; FPF; MS5; p55; p60; TBP1; TNF-R; TNFAR; TNFR1; p55-R; CD120a; TNFR55; TNFR60; TNF-R-I; TNF-R55; TNFR1-d2
Applications
Neutralization
Pricing


 Application Data
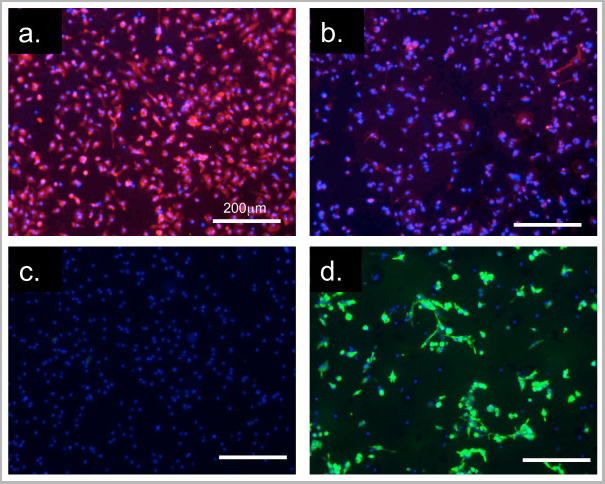
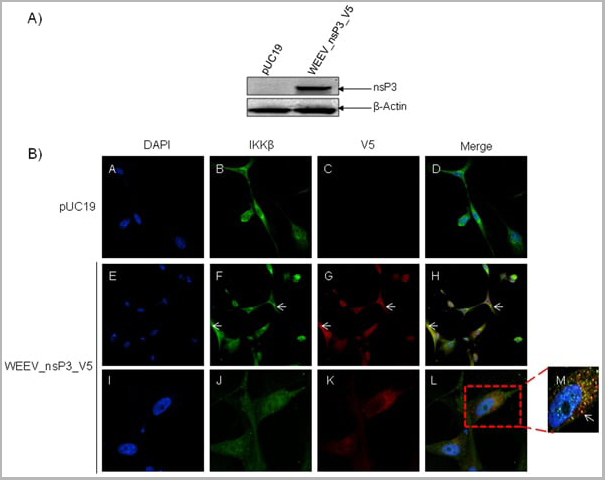
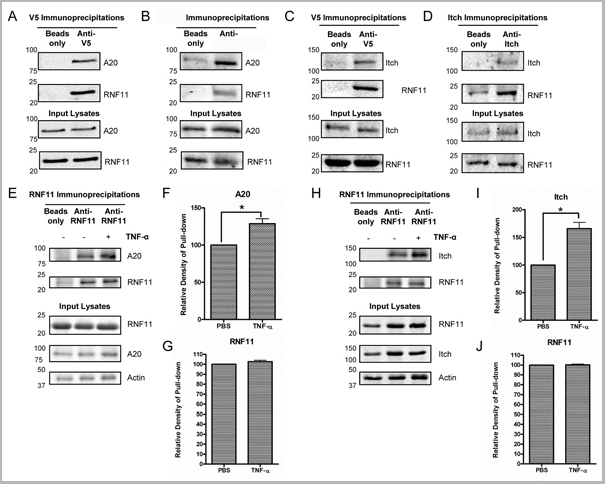
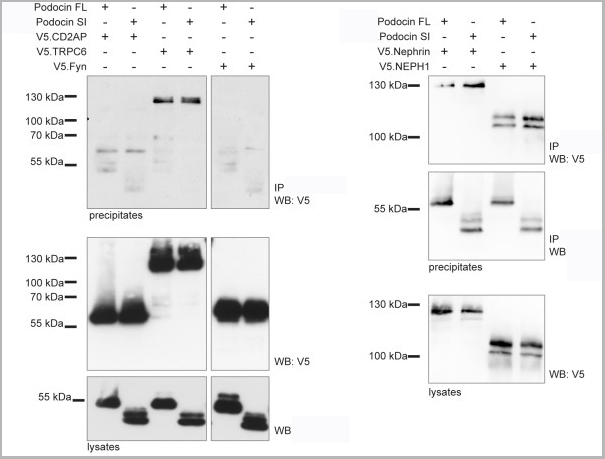
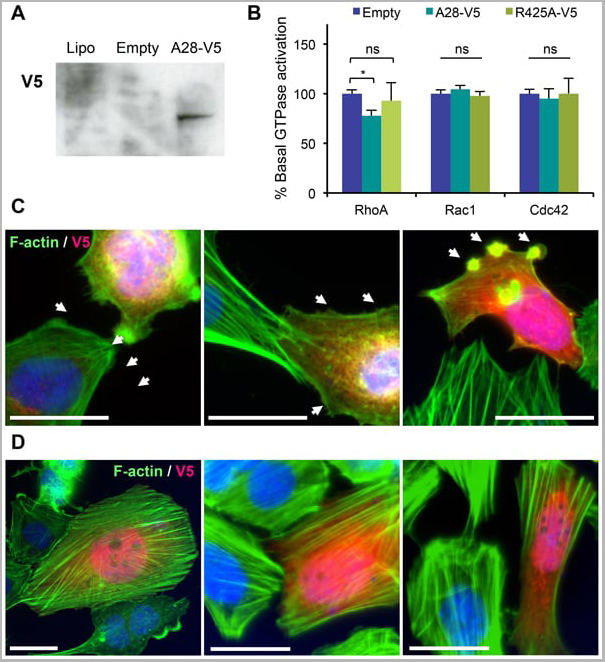
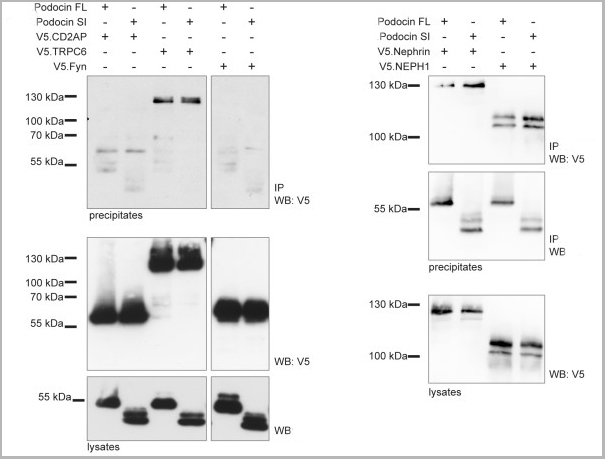
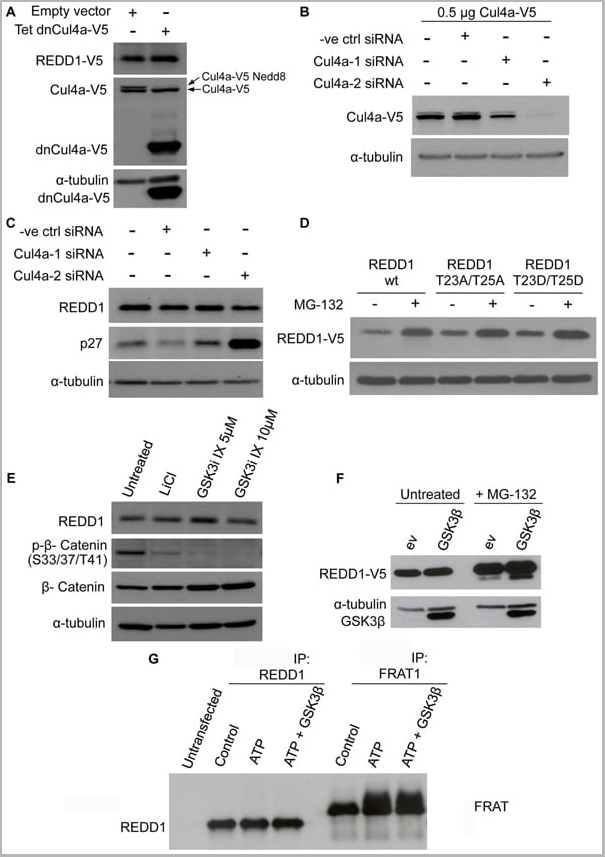
(Published customer image: Mouse anti V5 tag antibody, clone SV5-Pk1 used for the detection of V5 tagged WEEV_nsP3 protein by western blotting and immunofluorescenceImage caption: WEEV nsP3 interaction with host IKKbeta. A) U87MGs were transfected in a 6-well plate with 5 ug of pUC19 and WEEV_nsP3_HA for 24 hours. Cell lysates were resolved using SDS-PAGE and subsequently immunoblotted with V5 antibody and beta-actin served as a loading control. B) U87MGs were transfected with WEEV_nsP3_V5; cells were fixed after 24 hours and stained with antibodies against the endogenous IKKbeta and the V5 tag. Cells were incubated with appropriate secondary Alexa Fluor antibodies and the nuclei stained with DAPI. Co-localization of IKKbeta with WEEV_nsP3_V5 (yellow) was observed as shown by the arrows. B) Panels E -H serve as an example of transfected cells in a given field of view that show co-localization of IKKbeta and WEEV_nsP3_V5 24 hours post transfection. Panels I-L represent magnified images of other cells showing co-localization of IKKbeta and WEEV_nsP3_V5. Panel M is a magnified image of panel L. The co-localization was confirmed by Z-stack analysis. Co-localization was calculated to be approximately in 61% of cells (163 cells were counted of which 44% demonstrated expression of nsP3. Of those cells that expressed nsP3, 61% showed co-localization of both proteins). Images were taken using Nikon Eclipse TE2000-U at 60x magnification and are representative of 2 independent experiments.From: Amaya M, Voss K, Sampey G, Senina S, de la Fuente C, et al. (2014) The Role of IKKbeta in Venezuelan Equine Encephalitis Virus Infection. PLoS ONE 9(2): e86745.)
Application Data
(Published customer image: Mouse anti V5 tag antibody, clone SV5-Pk1 used for the detection of V5 tagged WEEV_nsP3 protein by western blotting and immunofluorescenceImage caption: WEEV nsP3 interaction with host IKKbeta. A) U87MGs were transfected in a 6-well plate with 5 ug of pUC19 and WEEV_nsP3_HA for 24 hours. Cell lysates were resolved using SDS-PAGE and subsequently immunoblotted with V5 antibody and beta-actin served as a loading control. B) U87MGs were transfected with WEEV_nsP3_V5; cells were fixed after 24 hours and stained with antibodies against the endogenous IKKbeta and the V5 tag. Cells were incubated with appropriate secondary Alexa Fluor antibodies and the nuclei stained with DAPI. Co-localization of IKKbeta with WEEV_nsP3_V5 (yellow) was observed as shown by the arrows. B) Panels E -H serve as an example of transfected cells in a given field of view that show co-localization of IKKbeta and WEEV_nsP3_V5 24 hours post transfection. Panels I-L represent magnified images of other cells showing co-localization of IKKbeta and WEEV_nsP3_V5. Panel M is a magnified image of panel L. The co-localization was confirmed by Z-stack analysis. Co-localization was calculated to be approximately in 61% of cells (163 cells were counted of which 44% demonstrated expression of nsP3. Of those cells that expressed nsP3, 61% showed co-localization of both proteins). Images were taken using Nikon Eclipse TE2000-U at 60x magnification and are representative of 2 independent experiments.From: Amaya M, Voss K, Sampey G, Senina S, de la Fuente C, et al. (2014) The Role of IKKbeta in Venezuelan Equine Encephalitis Virus Infection. PLoS ONE 9(2): e86745.)
V5-TAG, Monoclonal Antibody (Cat# AAA12081)
Full Name
MOUSE ANTI V5-TAG:HRP
Applications
Western Blot
Pricing


 Application Data
(Published customer image: Mouse anti V5 tag antibody, clone SV5-Pk1 used for the detection of V5 tagged WEEV_nsP3 protein by western blotting and immunofluorescenceImage caption: WEEV nsP3 interaction with host IKKbeta. A) U87MGs were transfected in a 6-well plate with 5 ug of pUC19 and WEEV_nsP3_HA for 24 hours. Cell lysates were resolved using SDS-PAGE and subsequently immunoblotted with V5 antibody and beta-actin served as a loading control. B) U87MGs were transfected with WEEV_nsP3_V5; cells were fixed after 24 hours and stained with antibodies against the endogenous IKKbeta and the V5 tag. Cells were incubated with appropriate secondary Alexa Fluor antibodies and the nuclei stained with DAPI. Co-localization of IKKbeta with WEEV_nsP3_V5 (yellow) was observed as shown by the arrows. B) Panels E -H serve as an example of transfected cells in a given field of view that show co-localization of IKKbeta and WEEV_nsP3_V5 24 hours post transfection. Panels I-L represent magnified images of other cells showing co-localization of IKKbeta and WEEV_nsP3_V5. Panel M is a magnified image of panel L. The co-localization was confirmed by Z-stack analysis. Co-localization was calculated to be approximately in 61% of cells (163 cells were counted of which 44% demonstrated expression of nsP3. Of those cells that expressed nsP3, 61% showed co-localization of both proteins). Images were taken using Nikon Eclipse TE2000-U at 60x magnification and are representative of 2 independent experiments.From: Amaya M, Voss K, Sampey G, Senina S, de la Fuente C, et al. (2014) The Role of IKKbeta in Venezuelan Equine Encephalitis Virus Infection. PLoS ONE 9(2): e86745.)
Application Data
(Published customer image: Mouse anti V5 tag antibody, clone SV5-Pk1 used for the detection of V5 tagged WEEV_nsP3 protein by western blotting and immunofluorescenceImage caption: WEEV nsP3 interaction with host IKKbeta. A) U87MGs were transfected in a 6-well plate with 5 ug of pUC19 and WEEV_nsP3_HA for 24 hours. Cell lysates were resolved using SDS-PAGE and subsequently immunoblotted with V5 antibody and beta-actin served as a loading control. B) U87MGs were transfected with WEEV_nsP3_V5; cells were fixed after 24 hours and stained with antibodies against the endogenous IKKbeta and the V5 tag. Cells were incubated with appropriate secondary Alexa Fluor antibodies and the nuclei stained with DAPI. Co-localization of IKKbeta with WEEV_nsP3_V5 (yellow) was observed as shown by the arrows. B) Panels E -H serve as an example of transfected cells in a given field of view that show co-localization of IKKbeta and WEEV_nsP3_V5 24 hours post transfection. Panels I-L represent magnified images of other cells showing co-localization of IKKbeta and WEEV_nsP3_V5. Panel M is a magnified image of panel L. The co-localization was confirmed by Z-stack analysis. Co-localization was calculated to be approximately in 61% of cells (163 cells were counted of which 44% demonstrated expression of nsP3. Of those cells that expressed nsP3, 61% showed co-localization of both proteins). Images were taken using Nikon Eclipse TE2000-U at 60x magnification and are representative of 2 independent experiments.From: Amaya M, Voss K, Sampey G, Senina S, de la Fuente C, et al. (2014) The Role of IKKbeta in Venezuelan Equine Encephalitis Virus Infection. PLoS ONE 9(2): e86745.)
V5-TAG, Monoclonal Antibody (Cat# AAA11930)
Full Name
MOUSE ANTI V5-TAG
Applications
Immunohistochemistry, Flow Cytometry, Immunofluorescence, Immunoprecipitation, Western Blot, Radioimmunoassay
Pricing


 Application Data
(Published customer image: Mouse anti V5 tag antibody, clone SV5-Pk1 used for the detection of V5 tagged WEEV_nsP3 protein by western blotting and immunofluorescenceImage caption: WEEV nsP3 interaction with host IKKbeta. A) U87MGs were transfected in a 6-well plate with 5 ug of pUC19 and WEEV_nsP3_HA for 24 hours. Cell lysates were resolved using SDS-PAGE and subsequently immunoblotted with V5 antibody and beta-actin served as a loading control. B) U87MGs were transfected with WEEV_nsP3_V5; cells were fixed after 24 hours and stained with antibodies against the endogenous IKKbeta and the V5 tag. Cells were incubated with appropriate secondary Alexa Fluor antibodies and the nuclei stained with DAPI. Co-localization of IKKbeta with WEEV_nsP3_V5 (yellow) was observed as shown by the arrows. B) Panels E -H serve as an example of transfected cells in a given field of view that show co-localization of IKKbeta and WEEV_nsP3_V5 24 hours post transfection. Panels I-L represent magnified images of other cells showing co-localization of IKKbeta and WEEV_nsP3_V5. Panel M is a magnified image of panel L. The co-localization was confirmed by Z-stack analysis. Co-localization was calculated to be approximately in 61% of cells (163 cells were counted of which 44% demonstrated expression of nsP3. Of those cells that expressed nsP3, 61% showed co-localization of both proteins). Images were taken using Nikon Eclipse TE2000-U at 60x magnification and are representative of 2 independent experiments.From: Amaya M, Voss K, Sampey G, Senina S, de la Fuente C, et al. (2014) The Role of IKKbeta in Venezuelan Equine Encephalitis Virus Infection. PLoS ONE 9(2): e86745.)
Application Data
(Published customer image: Mouse anti V5 tag antibody, clone SV5-Pk1 used for the detection of V5 tagged WEEV_nsP3 protein by western blotting and immunofluorescenceImage caption: WEEV nsP3 interaction with host IKKbeta. A) U87MGs were transfected in a 6-well plate with 5 ug of pUC19 and WEEV_nsP3_HA for 24 hours. Cell lysates were resolved using SDS-PAGE and subsequently immunoblotted with V5 antibody and beta-actin served as a loading control. B) U87MGs were transfected with WEEV_nsP3_V5; cells were fixed after 24 hours and stained with antibodies against the endogenous IKKbeta and the V5 tag. Cells were incubated with appropriate secondary Alexa Fluor antibodies and the nuclei stained with DAPI. Co-localization of IKKbeta with WEEV_nsP3_V5 (yellow) was observed as shown by the arrows. B) Panels E -H serve as an example of transfected cells in a given field of view that show co-localization of IKKbeta and WEEV_nsP3_V5 24 hours post transfection. Panels I-L represent magnified images of other cells showing co-localization of IKKbeta and WEEV_nsP3_V5. Panel M is a magnified image of panel L. The co-localization was confirmed by Z-stack analysis. Co-localization was calculated to be approximately in 61% of cells (163 cells were counted of which 44% demonstrated expression of nsP3. Of those cells that expressed nsP3, 61% showed co-localization of both proteins). Images were taken using Nikon Eclipse TE2000-U at 60x magnification and are representative of 2 independent experiments.From: Amaya M, Voss K, Sampey G, Senina S, de la Fuente C, et al. (2014) The Role of IKKbeta in Venezuelan Equine Encephalitis Virus Infection. PLoS ONE 9(2): e86745.)
V5-TAG, Monoclonal Antibody (Cat# AAA11864)
Full Name
MOUSE ANTI V5-TAG:FITC
Applications
Immunofluorescence
Pricing


 Application Data
(Published customer image: Mouse anti V5 tag antibody, clone SV5-Pk1 used for the detection of V5 tagged WEEV_nsP3 protein by western blotting and immunofluorescenceImage caption: WEEV nsP3 interaction with host IKKbeta. A) U87MGs were transfected in a 6-well plate with 5 ug of pUC19 and WEEV_nsP3_HA for 24 hours. Cell lysates were resolved using SDS-PAGE and subsequently immunoblotted with V5 antibody and beta-actin served as a loading control. B) U87MGs were transfected with WEEV_nsP3_V5; cells were fixed after 24 hours and stained with antibodies against the endogenous IKKbeta and the V5 tag. Cells were incubated with appropriate secondary Alexa Fluor antibodies and the nuclei stained with DAPI. Co-localization of IKKbeta with WEEV_nsP3_V5 (yellow) was observed as shown by the arrows. B) Panels E -H serve as an example of transfected cells in a given field of view that show co-localization of IKKbeta and WEEV_nsP3_V5 24 hours post transfection. Panels I-L represent magnified images of other cells showing co-localization of IKKbeta and WEEV_nsP3_V5. Panel M is a magnified image of panel L. The co-localization was confirmed by Z-stack analysis. Co-localization was calculated to be approximately in 61% of cells (163 cells were counted of which 44% demonstrated expression of nsP3. Of those cells that expressed nsP3, 61% showed co-localization of both proteins). Images were taken using Nikon Eclipse TE2000-U at 60x magnification and are representative of 2 independent experiments.From: Amaya M, Voss K, Sampey G, Senina S, de la Fuente C, et al. (2014) The Role of IKKbeta in Venezuelan Equine Encephalitis Virus Infection. PLoS ONE 9(2): e86745.)
Application Data
(Published customer image: Mouse anti V5 tag antibody, clone SV5-Pk1 used for the detection of V5 tagged WEEV_nsP3 protein by western blotting and immunofluorescenceImage caption: WEEV nsP3 interaction with host IKKbeta. A) U87MGs were transfected in a 6-well plate with 5 ug of pUC19 and WEEV_nsP3_HA for 24 hours. Cell lysates were resolved using SDS-PAGE and subsequently immunoblotted with V5 antibody and beta-actin served as a loading control. B) U87MGs were transfected with WEEV_nsP3_V5; cells were fixed after 24 hours and stained with antibodies against the endogenous IKKbeta and the V5 tag. Cells were incubated with appropriate secondary Alexa Fluor antibodies and the nuclei stained with DAPI. Co-localization of IKKbeta with WEEV_nsP3_V5 (yellow) was observed as shown by the arrows. B) Panels E -H serve as an example of transfected cells in a given field of view that show co-localization of IKKbeta and WEEV_nsP3_V5 24 hours post transfection. Panels I-L represent magnified images of other cells showing co-localization of IKKbeta and WEEV_nsP3_V5. Panel M is a magnified image of panel L. The co-localization was confirmed by Z-stack analysis. Co-localization was calculated to be approximately in 61% of cells (163 cells were counted of which 44% demonstrated expression of nsP3. Of those cells that expressed nsP3, 61% showed co-localization of both proteins). Images were taken using Nikon Eclipse TE2000-U at 60x magnification and are representative of 2 independent experiments.From: Amaya M, Voss K, Sampey G, Senina S, de la Fuente C, et al. (2014) The Role of IKKbeta in Venezuelan Equine Encephalitis Virus Infection. PLoS ONE 9(2): e86745.)
V5-TAG, Monoclonal Antibody (Cat# AAA12211)
Full Name
MOUSE ANTI V5-TAG
Applications
Immunohistochemistry, Flow Cytometry, Immunofluorescence, Immunoprecipitation, Western Blot, Radioimmunoassay
Pricing
 Application Data
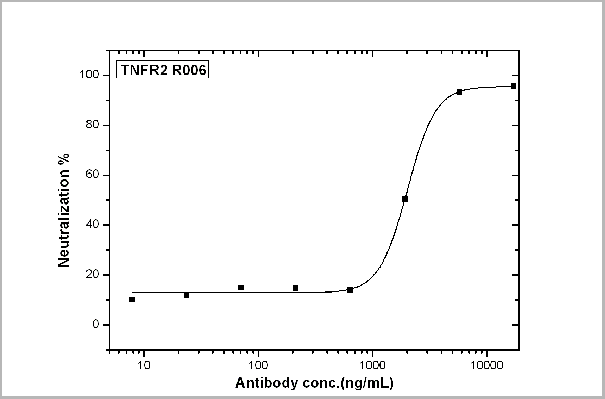
(TNFR2/TNFRSF1B-mediated inhibition of cytotoxicity was Neutralized by Human TNFR2 Antibody. Recombinant Human TNFR2/TNFRSF1B inhibits Recombinant Human TNFa induced cytotoxicity in the L-929 mouse fibroblast cell line. Inhibition of Recombinant Human TNFa (0.25 ng/mL) activity elicited by Recombinant Human TNFR2/TNFRSF1B (1 ug/mL) is neutralized by increasing concentrations of Human TNFR2/TNFRSF1B Monoclonal Antibody. The IC50 is typically 1-3 ug/mL in the presence of the metabolic inhibitor actinomycin D (1 ug/mL).)
Application Data
(TNFR2/TNFRSF1B-mediated inhibition of cytotoxicity was Neutralized by Human TNFR2 Antibody. Recombinant Human TNFR2/TNFRSF1B inhibits Recombinant Human TNFa induced cytotoxicity in the L-929 mouse fibroblast cell line. Inhibition of Recombinant Human TNFa (0.25 ng/mL) activity elicited by Recombinant Human TNFR2/TNFRSF1B (1 ug/mL) is neutralized by increasing concentrations of Human TNFR2/TNFRSF1B Monoclonal Antibody. The IC50 is typically 1-3 ug/mL in the presence of the metabolic inhibitor actinomycin D (1 ug/mL).)
TNFR2/CD120b/TNFRSF1B, Monoclonal Antibody (Cat# AAA27733)
Full Name
TNFR2/CD120b/TNFRSF1B Neutralizing Antibody
Gene Names
TNFRSF1B; p75; TBPII; TNFBR; TNFR2; CD120b; TNFR1B; TNFR80; TNF-R75; p75TNFR; TNF-R-II
Reactivity
Human
Applications
Blocking, Neutralization
Purity
>95% SDS-PAGE
Pricing


 Application Data
(Published customer image: Mouse anti V5 tag antibody, clone SV5-Pk1 used for the detection of V5 tagged WEEV_nsP3 protein by western blotting and immunofluorescenceImage caption: WEEV nsP3 interaction with host IKKbeta. A) U87MGs were transfected in a 6-well plate with 5 ug of pUC19 and WEEV_nsP3_HA for 24 hours. Cell lysates were resolved using SDS-PAGE and subsequently immunoblotted with V5 antibody and beta-actin served as a loading control. B) U87MGs were transfected with WEEV_nsP3_V5; cells were fixed after 24 hours and stained with antibodies against the endogenous IKKbeta and the V5 tag. Cells were incubated with appropriate secondary Alexa Fluor antibodies and the nuclei stained with DAPI. Co-localization of IKKbeta with WEEV_nsP3_V5 (yellow) was observed as shown by the arrows. B) Panels E -H serve as an example of transfected cells in a given field of view that show co-localization of IKKbeta and WEEV_nsP3_V5 24 hours post transfection. Panels I-L represent magnified images of other cells showing co-localization of IKKbeta and WEEV_nsP3_V5. Panel M is a magnified image of panel L. The co-localization was confirmed by Z-stack analysis. Co-localization was calculated to be approximately in 61% of cells (163 cells were counted of which 44% demonstrated expression of nsP3. Of those cells that expressed nsP3, 61% showed co-localization of both proteins). Images were taken using Nikon Eclipse TE2000-U at 60x magnification and are representative of 2 independent experiments.From: Amaya M, Voss K, Sampey G, Senina S, de la Fuente C, et al. (2014) The Role of IKKbeta in Venezuelan Equine Encephalitis Virus Infection. PLoS ONE 9(2): e86745.)
Application Data
(Published customer image: Mouse anti V5 tag antibody, clone SV5-Pk1 used for the detection of V5 tagged WEEV_nsP3 protein by western blotting and immunofluorescenceImage caption: WEEV nsP3 interaction with host IKKbeta. A) U87MGs were transfected in a 6-well plate with 5 ug of pUC19 and WEEV_nsP3_HA for 24 hours. Cell lysates were resolved using SDS-PAGE and subsequently immunoblotted with V5 antibody and beta-actin served as a loading control. B) U87MGs were transfected with WEEV_nsP3_V5; cells were fixed after 24 hours and stained with antibodies against the endogenous IKKbeta and the V5 tag. Cells were incubated with appropriate secondary Alexa Fluor antibodies and the nuclei stained with DAPI. Co-localization of IKKbeta with WEEV_nsP3_V5 (yellow) was observed as shown by the arrows. B) Panels E -H serve as an example of transfected cells in a given field of view that show co-localization of IKKbeta and WEEV_nsP3_V5 24 hours post transfection. Panels I-L represent magnified images of other cells showing co-localization of IKKbeta and WEEV_nsP3_V5. Panel M is a magnified image of panel L. The co-localization was confirmed by Z-stack analysis. Co-localization was calculated to be approximately in 61% of cells (163 cells were counted of which 44% demonstrated expression of nsP3. Of those cells that expressed nsP3, 61% showed co-localization of both proteins). Images were taken using Nikon Eclipse TE2000-U at 60x magnification and are representative of 2 independent experiments.From: Amaya M, Voss K, Sampey G, Senina S, de la Fuente C, et al. (2014) The Role of IKKbeta in Venezuelan Equine Encephalitis Virus Infection. PLoS ONE 9(2): e86745.)
V5-TAG, Monoclonal Antibody (Cat# AAA11850)
Full Name
MOUSE ANTI V5-TAG:Biotin
Applications
Immunohistochemistry, Western Blot
Pricing