Filters
Clonality
Type
Reactivity
Gene Name
Isotype
Host
Application
Clone
10 results for " Vasculature" - showing 1-10


 Application Data
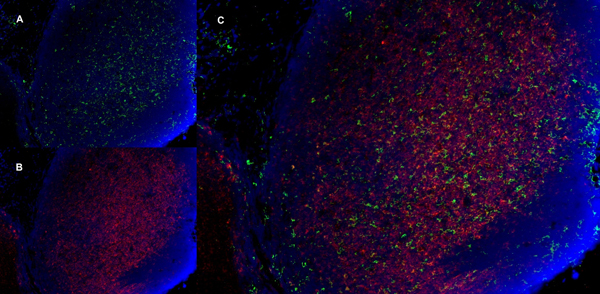
(Published Customer Image:Mouse CD31 antibody, clone ER-MP12 used for the demonstration of vasculature in mouse brain by immunofluorescence.Image caption:Inhibition of 2-AG hydrolysis reduces LPS-induced BBB permeability. a, b Fibrinogen levels in b plasma and the a ratio of brain to plasma fibrinogen were assessed by ELISA. n?=?5/7 mice per group. c, d Fluorescent immunostaining in the striatum for fibrinogen (red) and vascular marker (CD31; green) demonstrated leakage of fibrinogen into the brain with vehicle treatment, whereas vascular integrity was preserved when (e, f) MAGL was inhibited. g Extravascular fibrinogen was semi-quantitated in fluorescently labeled sections of the striatum. Bar graphs were plotted with mean?+/-SEM and data analyzed using one-way analysis of variance (ANOVA) with Tukey post-hoc comparisons. n = 5/7 mice per group. Significance is shown as *p?)
Application Data
(Published Customer Image:Mouse CD31 antibody, clone ER-MP12 used for the demonstration of vasculature in mouse brain by immunofluorescence.Image caption:Inhibition of 2-AG hydrolysis reduces LPS-induced BBB permeability. a, b Fibrinogen levels in b plasma and the a ratio of brain to plasma fibrinogen were assessed by ELISA. n?=?5/7 mice per group. c, d Fluorescent immunostaining in the striatum for fibrinogen (red) and vascular marker (CD31; green) demonstrated leakage of fibrinogen into the brain with vehicle treatment, whereas vascular integrity was preserved when (e, f) MAGL was inhibited. g Extravascular fibrinogen was semi-quantitated in fluorescently labeled sections of the striatum. Bar graphs were plotted with mean?+/-SEM and data analyzed using one-way analysis of variance (ANOVA) with Tukey post-hoc comparisons. n = 5/7 mice per group. Significance is shown as *p?)
CD31, Monoclonal Antibody (Cat# AAA12258)
Full Name
Rat Anti Mouse CD31: FITC
Gene Names
Pecam1; Cd31; Pecam; C85791; PECAM-1
Reactivity
Mouse
Applications
Flow Cytometry
Purity
Purified IgG prepared by affinity chromatography on Protein G from tissue culture supernatant
Pricing


 Application Data
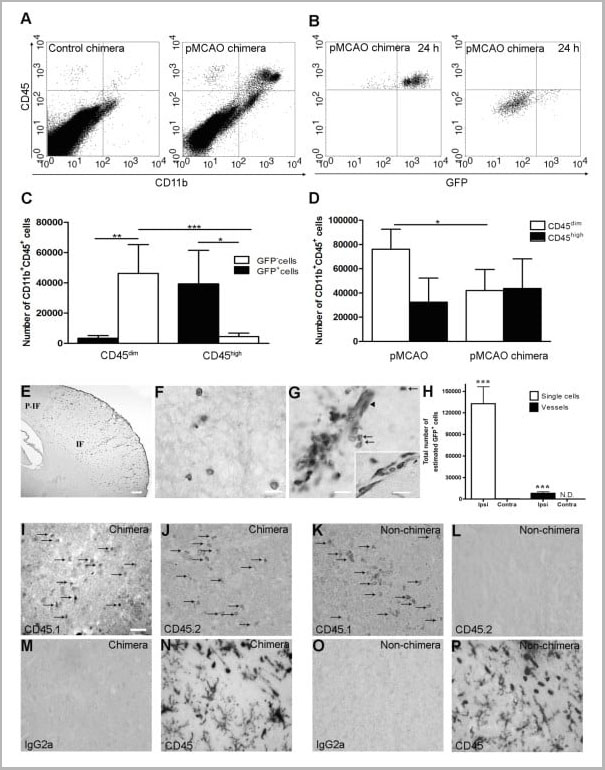
(Published customer image Infiltration of GFP+ BM-cells in infarct and peri-infarct regions. (A-B) Dot plots of viable macrophages/granulocytes (CD11b+CD45high, top right quadrants) and microglia (CD11b+CD45dim, bottom right quadrants) in cortex from BM-chimeric unmanipulated mice and mice exposed to pMCAO. (C) Bar graph showing mean numbers of CD11b+CD45dim microglia and CD11b+CD45high macrophages/granulocytes in BM-chimeric mice 24 hours after pMCAO, subdivided based on expression of GFP (n = 5). Approximately 92% of of the CD45high population were GFP+. (D) Estimation and comparison of mean numbers of CD11b+CD45dim microglia in non-chimeric (n = 10) versus BM-chimeric mice (n = 5) 24 hours after of pMCAO shows significantly fewer CD11b+CD45dim microglial cells in irradiated mice. (E) Overview, showing distribution of infiltrating GFP+ BM-derived cells into infarct (IF) and peri-infarct (P-IF) regions 24 hours after pMCAO. (E-G) By 24 hours, GFP+ single cells (F) and vessel-associated aggregates of GFP+ cells (arrows in G) were observed in infarct and peri-infarct regions. Some of the vessel-associated cells were round, leukocyte-like cells (arrows) while others were elongated cells lining the vasculature (arrow heads in G and in insert). (H) Bar graph showing mean numbers of single GFP+ cells and vessel-associated aggregates of GFP+ cells in ipsi- and contralateral cortex 24 hours after surgery (n = 10). (I-P) Immunohistochemical staining of CD45.1 (I, K), CD45.2 (J, L), IgG2a (M, O) and CD45 (N, P) in ischemic tissue in BM-chimeric (I, J, M, N) and non-chimeric mice (K, L, O, P) 24 hours after pMCAO. N.D, none detected. Scale bars: 200 um (A), 10 um (B, C). 50 um (I-P) *P < 0.05, **P < 0.01, and ***P < 0.001.From: Clausen BH, Lambertsen KL, Babcock AA, Holm TH, Dagnaes-Hansen F, Finsen B. Interleukin-1beta and tumor necrosis factor-alpha are expressed by different subsets of microglia and macrophages after ischemic stroke in mice. J Neuroinflammation. 2008 Oct 23;5:46.)
Application Data
(Published customer image Infiltration of GFP+ BM-cells in infarct and peri-infarct regions. (A-B) Dot plots of viable macrophages/granulocytes (CD11b+CD45high, top right quadrants) and microglia (CD11b+CD45dim, bottom right quadrants) in cortex from BM-chimeric unmanipulated mice and mice exposed to pMCAO. (C) Bar graph showing mean numbers of CD11b+CD45dim microglia and CD11b+CD45high macrophages/granulocytes in BM-chimeric mice 24 hours after pMCAO, subdivided based on expression of GFP (n = 5). Approximately 92% of of the CD45high population were GFP+. (D) Estimation and comparison of mean numbers of CD11b+CD45dim microglia in non-chimeric (n = 10) versus BM-chimeric mice (n = 5) 24 hours after of pMCAO shows significantly fewer CD11b+CD45dim microglial cells in irradiated mice. (E) Overview, showing distribution of infiltrating GFP+ BM-derived cells into infarct (IF) and peri-infarct (P-IF) regions 24 hours after pMCAO. (E-G) By 24 hours, GFP+ single cells (F) and vessel-associated aggregates of GFP+ cells (arrows in G) were observed in infarct and peri-infarct regions. Some of the vessel-associated cells were round, leukocyte-like cells (arrows) while others were elongated cells lining the vasculature (arrow heads in G and in insert). (H) Bar graph showing mean numbers of single GFP+ cells and vessel-associated aggregates of GFP+ cells in ipsi- and contralateral cortex 24 hours after surgery (n = 10). (I-P) Immunohistochemical staining of CD45.1 (I, K), CD45.2 (J, L), IgG2a (M, O) and CD45 (N, P) in ischemic tissue in BM-chimeric (I, J, M, N) and non-chimeric mice (K, L, O, P) 24 hours after pMCAO. N.D, none detected. Scale bars: 200 um (A), 10 um (B, C). 50 um (I-P) *P < 0.05, **P < 0.01, and ***P < 0.001.From: Clausen BH, Lambertsen KL, Babcock AA, Holm TH, Dagnaes-Hansen F, Finsen B. Interleukin-1beta and tumor necrosis factor-alpha are expressed by different subsets of microglia and macrophages after ischemic stroke in mice. J Neuroinflammation. 2008 Oct 23;5:46.)
CD11b, Monoclonal Antibody (Cat# AAA12182)
Full Name
RAT ANTI MOUSE CD11b:FITC
Gene Names
Itgam; CR3; CR3A; MAC1; Cd11b; Ly-40; Mac-1; Mac-1a; CD11b/CD18; F730045J24Rik
Applications
Flow Cytometry
Pricing
 WB (Western Blot)
(Western blot analysis of Podoplanin expression in human placenta lysate (AAA11696).Electrophoresis was performed on a 5-20% SDS-PAGE gel at 70V (Stacking gel) / 90V (Resolving gel) for 2-3 hours. The sample well of each lane was loaded with 50ug of sample under reducing conditions. After Electrophoresis, proteins were transferred to a Nitrocellulose membrane at 150mA for 50-90 minutes. Blocked the membrane with 5% Non-fat Milk/ TBS for 1.5 hour at RT. The membrane was incubated with rabbit anti-PDPN monoclonal antibody overnight at 4 degree C, then washed with TBS-0.1%Tween 3 times with 5 minutes each and probed with a goat anti-rabbit IgG-HRP secondary antibody at a dilution of 1:10000 for 1.5 hour at RT. The signal is developed using an Enhanced Chemiluminescent detection (ECL) kit with Tanon 5200 system. A specific band was detected for PDPN)
WB (Western Blot)
(Western blot analysis of Podoplanin expression in human placenta lysate (AAA11696).Electrophoresis was performed on a 5-20% SDS-PAGE gel at 70V (Stacking gel) / 90V (Resolving gel) for 2-3 hours. The sample well of each lane was loaded with 50ug of sample under reducing conditions. After Electrophoresis, proteins were transferred to a Nitrocellulose membrane at 150mA for 50-90 minutes. Blocked the membrane with 5% Non-fat Milk/ TBS for 1.5 hour at RT. The membrane was incubated with rabbit anti-PDPN monoclonal antibody overnight at 4 degree C, then washed with TBS-0.1%Tween 3 times with 5 minutes each and probed with a goat anti-rabbit IgG-HRP secondary antibody at a dilution of 1:10000 for 1.5 hour at RT. The signal is developed using an Enhanced Chemiluminescent detection (ECL) kit with Tanon 5200 system. A specific band was detected for PDPN)
Podoplanin, Monoclonal Antibody (Cat# AAA11696)
Full Name
Anti-Podoplanin Rabbit Monoclonal Antibody tested for WB in Human, Mouse, Rat.
Gene Names
PDPN; T1A; GP36; GP40; Gp38; OTS8; T1A2; TI1A; T1A-2; AGGRUS; HT1A-1; PA2.26
Reactivity
Human, Mouse, Rat
Applications
Western Blot
Purity
Affinity-chromatography
Pricing


 Application Data
(Published customer image Infiltration of GFP+ BM-cells in infarct and peri-infarct regions. (A-B) Dot plots of viable macrophages/granulocytes (CD11b+CD45high, top right quadrants) and microglia (CD11b+CD45dim, bottom right quadrants) in cortex from BM-chimeric unmanipulated mice and mice exposed to pMCAO. (C) Bar graph showing mean numbers of CD11b+CD45dim microglia and CD11b+CD45high macrophages/granulocytes in BM-chimeric mice 24 hours after pMCAO, subdivided based on expression of GFP (n = 5). Approximately 92% of of the CD45high population were GFP+. (D) Estimation and comparison of mean numbers of CD11b+CD45dim microglia in non-chimeric (n = 10) versus BM-chimeric mice (n = 5) 24 hours after of pMCAO shows significantly fewer CD11b+CD45dim microglial cells in irradiated mice. (E) Overview, showing distribution of infiltrating GFP+ BM-derived cells into infarct (IF) and peri-infarct (P-IF) regions 24 hours after pMCAO. (E-G) By 24 hours, GFP+ single cells (F) and vessel-associated aggregates of GFP+ cells (arrows in G) were observed in infarct and peri-infarct regions. Some of the vessel-associated cells were round, leukocyte-like cells (arrows) while others were elongated cells lining the vasculature (arrow heads in G and in insert). (H) Bar graph showing mean numbers of single GFP+ cells and vessel-associated aggregates of GFP+ cells in ipsi- and contralateral cortex 24 hours after surgery (n = 10). (I-P) Immunohistochemical staining of CD45.1 (I, K), CD45.2 (J, L), IgG2a (M, O) and CD45 (N, P) in ischemic tissue in BM-chimeric (I, J, M, N) and non-chimeric mice (K, L, O, P) 24 hours after pMCAO. N.D, none detected. Scale bars: 200 um (A), 10 um (B, C). 50 um (I-P) *P < 0.05, **P < 0.01, and ***P < 0.001.From: Clausen BH, Lambertsen KL, Babcock AA, Holm TH, Dagnaes-Hansen F, Finsen B. Interleukin-1beta and tumor necrosis factor-alpha are expressed by different subsets of microglia and macrophages after ischemic stroke in mice. J Neuroinflammation. 2008 Oct 23;5:46.)
Application Data
(Published customer image Infiltration of GFP+ BM-cells in infarct and peri-infarct regions. (A-B) Dot plots of viable macrophages/granulocytes (CD11b+CD45high, top right quadrants) and microglia (CD11b+CD45dim, bottom right quadrants) in cortex from BM-chimeric unmanipulated mice and mice exposed to pMCAO. (C) Bar graph showing mean numbers of CD11b+CD45dim microglia and CD11b+CD45high macrophages/granulocytes in BM-chimeric mice 24 hours after pMCAO, subdivided based on expression of GFP (n = 5). Approximately 92% of of the CD45high population were GFP+. (D) Estimation and comparison of mean numbers of CD11b+CD45dim microglia in non-chimeric (n = 10) versus BM-chimeric mice (n = 5) 24 hours after of pMCAO shows significantly fewer CD11b+CD45dim microglial cells in irradiated mice. (E) Overview, showing distribution of infiltrating GFP+ BM-derived cells into infarct (IF) and peri-infarct (P-IF) regions 24 hours after pMCAO. (E-G) By 24 hours, GFP+ single cells (F) and vessel-associated aggregates of GFP+ cells (arrows in G) were observed in infarct and peri-infarct regions. Some of the vessel-associated cells were round, leukocyte-like cells (arrows) while others were elongated cells lining the vasculature (arrow heads in G and in insert). (H) Bar graph showing mean numbers of single GFP+ cells and vessel-associated aggregates of GFP+ cells in ipsi- and contralateral cortex 24 hours after surgery (n = 10). (I-P) Immunohistochemical staining of CD45.1 (I, K), CD45.2 (J, L), IgG2a (M, O) and CD45 (N, P) in ischemic tissue in BM-chimeric (I, J, M, N) and non-chimeric mice (K, L, O, P) 24 hours after pMCAO. N.D, none detected. Scale bars: 200 um (A), 10 um (B, C). 50 um (I-P) *P < 0.05, **P < 0.01, and ***P < 0.001.From: Clausen BH, Lambertsen KL, Babcock AA, Holm TH, Dagnaes-Hansen F, Finsen B. Interleukin-1beta and tumor necrosis factor-alpha are expressed by different subsets of microglia and macrophages after ischemic stroke in mice. J Neuroinflammation. 2008 Oct 23;5:46.)
CD11b, Monoclonal Antibody (Cat# AAA12184)
Full Name
RAT ANTI MOUSE CD11b
Gene Names
Itgam; CR3; CR3A; MAC1; Cd11b; Ly-40; Mac-1; Mac-1a; CD11b/CD18; F730045J24Rik
Applications
Immunohistochemistry, Flow Cytometry, Immunofluorescence, Immunoprecipitation
Pricing


 Application Data
(Published customer image Infiltration of GFP+ BM-cells in infarct and peri-infarct regions. (A-B) Dot plots of viable macrophages/granulocytes (CD11b+CD45high, top right quadrants) and microglia (CD11b+CD45dim, bottom right quadrants) in cortex from BM-chimeric unmanipulated mice and mice exposed to pMCAO. (C) Bar graph showing mean numbers of CD11b+CD45dim microglia and CD11b+CD45high macrophages/granulocytes in BM-chimeric mice 24 hours after pMCAO, subdivided based on expression of GFP (n = 5). Approximately 92% of of the CD45high population were GFP+. (D) Estimation and comparison of mean numbers of CD11b+CD45dim microglia in non-chimeric (n = 10) versus BM-chimeric mice (n = 5) 24 hours after of pMCAO shows significantly fewer CD11b+CD45dim microglial cells in irradiated mice. (E) Overview, showing distribution of infiltrating GFP+ BM-derived cells into infarct (IF) and peri-infarct (P-IF) regions 24 hours after pMCAO. (E-G) By 24 hours, GFP+ single cells (F) and vessel-associated aggregates of GFP+ cells (arrows in G) were observed in infarct and peri-infarct regions. Some of the vessel-associated cells were round, leukocyte-like cells (arrows) while others were elongated cells lining the vasculature (arrow heads in G and in insert). (H) Bar graph showing mean numbers of single GFP+ cells and vessel-associated aggregates of GFP+ cells in ipsi- and contralateral cortex 24 hours after surgery (n = 10). (I-P) Immunohistochemical staining of CD45.1 (I, K), CD45.2 (J, L), IgG2a (M, O) and CD45 (N, P) in ischemic tissue in BM-chimeric (I, J, M, N) and non-chimeric mice (K, L, O, P) 24 hours after pMCAO. N.D, none detected. Scale bars: 200 um (A), 10 um (B, C). 50 um (I-P) *P < 0.05, **P < 0.01, and ***P < 0.001.From: Clausen BH, Lambertsen KL, Babcock AA, Holm TH, Dagnaes-Hansen F, Finsen B. Interleukin-1beta and tumor necrosis factor-alpha are expressed by different subsets of microglia and macrophages after ischemic stroke in mice. J Neuroinflammation. 2008 Oct 23;5:46.)
Application Data
(Published customer image Infiltration of GFP+ BM-cells in infarct and peri-infarct regions. (A-B) Dot plots of viable macrophages/granulocytes (CD11b+CD45high, top right quadrants) and microglia (CD11b+CD45dim, bottom right quadrants) in cortex from BM-chimeric unmanipulated mice and mice exposed to pMCAO. (C) Bar graph showing mean numbers of CD11b+CD45dim microglia and CD11b+CD45high macrophages/granulocytes in BM-chimeric mice 24 hours after pMCAO, subdivided based on expression of GFP (n = 5). Approximately 92% of of the CD45high population were GFP+. (D) Estimation and comparison of mean numbers of CD11b+CD45dim microglia in non-chimeric (n = 10) versus BM-chimeric mice (n = 5) 24 hours after of pMCAO shows significantly fewer CD11b+CD45dim microglial cells in irradiated mice. (E) Overview, showing distribution of infiltrating GFP+ BM-derived cells into infarct (IF) and peri-infarct (P-IF) regions 24 hours after pMCAO. (E-G) By 24 hours, GFP+ single cells (F) and vessel-associated aggregates of GFP+ cells (arrows in G) were observed in infarct and peri-infarct regions. Some of the vessel-associated cells were round, leukocyte-like cells (arrows) while others were elongated cells lining the vasculature (arrow heads in G and in insert). (H) Bar graph showing mean numbers of single GFP+ cells and vessel-associated aggregates of GFP+ cells in ipsi- and contralateral cortex 24 hours after surgery (n = 10). (I-P) Immunohistochemical staining of CD45.1 (I, K), CD45.2 (J, L), IgG2a (M, O) and CD45 (N, P) in ischemic tissue in BM-chimeric (I, J, M, N) and non-chimeric mice (K, L, O, P) 24 hours after pMCAO. N.D, none detected. Scale bars: 200 um (A), 10 um (B, C). 50 um (I-P) *P < 0.05, **P < 0.01, and ***P < 0.001.From: Clausen BH, Lambertsen KL, Babcock AA, Holm TH, Dagnaes-Hansen F, Finsen B. Interleukin-1beta and tumor necrosis factor-alpha are expressed by different subsets of microglia and macrophages after ischemic stroke in mice. J Neuroinflammation. 2008 Oct 23;5:46.)
CD11b, Monoclonal Antibody (Cat# AAA12183)
Full Name
RAT ANTI MOUSE CD11b:FITC
Gene Names
Itgam; CR3; CR3A; MAC1; Cd11b; Ly-40; Mac-1; Mac-1a; CD11b/CD18; F730045J24Rik
Applications
Flow Cytometry
Pricing


 Application Data
(Published customer image Infiltration of GFP+ BM-cells in infarct and peri-infarct regions. (A-B) Dot plots of viable macrophages/granulocytes (CD11b+CD45high, top right quadrants) and microglia (CD11b+CD45dim, bottom right quadrants) in cortex from BM-chimeric unmanipulated mice and mice exposed to pMCAO. (C) Bar graph showing mean numbers of CD11b+CD45dim microglia and CD11b+CD45high macrophages/granulocytes in BM-chimeric mice 24 hours after pMCAO, subdivided based on expression of GFP (n = 5). Approximately 92% of of the CD45high population were GFP+. (D) Estimation and comparison of mean numbers of CD11b+CD45dim microglia in non-chimeric (n = 10) versus BM-chimeric mice (n = 5) 24 hours after of pMCAO shows significantly fewer CD11b+CD45dim microglial cells in irradiated mice. (E) Overview, showing distribution of infiltrating GFP+ BM-derived cells into infarct (IF) and peri-infarct (P-IF) regions 24 hours after pMCAO. (E-G) By 24 hours, GFP+ single cells (F) and vessel-associated aggregates of GFP+ cells (arrows in G) were observed in infarct and peri-infarct regions. Some of the vessel-associated cells were round, leukocyte-like cells (arrows) while others were elongated cells lining the vasculature (arrow heads in G and in insert). (H) Bar graph showing mean numbers of single GFP+ cells and vessel-associated aggregates of GFP+ cells in ipsi- and contralateral cortex 24 hours after surgery (n = 10). (I-P) Immunohistochemical staining of CD45.1 (I, K), CD45.2 (J, L), IgG2a (M, O) and CD45 (N, P) in ischemic tissue in BM-chimeric (I, J, M, N) and non-chimeric mice (K, L, O, P) 24 hours after pMCAO. N.D, none detected. Scale bars: 200 um (A), 10 um (B, C). 50 um (I-P) *P < 0.05, **P < 0.01, and ***P < 0.001.From: Clausen BH, Lambertsen KL, Babcock AA, Holm TH, Dagnaes-Hansen F, Finsen B. Interleukin-1beta and tumor necrosis factor-alpha are expressed by different subsets of microglia and macrophages after ischemic stroke in mice. J Neuroinflammation. 2008 Oct 23;5:46.)
Application Data
(Published customer image Infiltration of GFP+ BM-cells in infarct and peri-infarct regions. (A-B) Dot plots of viable macrophages/granulocytes (CD11b+CD45high, top right quadrants) and microglia (CD11b+CD45dim, bottom right quadrants) in cortex from BM-chimeric unmanipulated mice and mice exposed to pMCAO. (C) Bar graph showing mean numbers of CD11b+CD45dim microglia and CD11b+CD45high macrophages/granulocytes in BM-chimeric mice 24 hours after pMCAO, subdivided based on expression of GFP (n = 5). Approximately 92% of of the CD45high population were GFP+. (D) Estimation and comparison of mean numbers of CD11b+CD45dim microglia in non-chimeric (n = 10) versus BM-chimeric mice (n = 5) 24 hours after of pMCAO shows significantly fewer CD11b+CD45dim microglial cells in irradiated mice. (E) Overview, showing distribution of infiltrating GFP+ BM-derived cells into infarct (IF) and peri-infarct (P-IF) regions 24 hours after pMCAO. (E-G) By 24 hours, GFP+ single cells (F) and vessel-associated aggregates of GFP+ cells (arrows in G) were observed in infarct and peri-infarct regions. Some of the vessel-associated cells were round, leukocyte-like cells (arrows) while others were elongated cells lining the vasculature (arrow heads in G and in insert). (H) Bar graph showing mean numbers of single GFP+ cells and vessel-associated aggregates of GFP+ cells in ipsi- and contralateral cortex 24 hours after surgery (n = 10). (I-P) Immunohistochemical staining of CD45.1 (I, K), CD45.2 (J, L), IgG2a (M, O) and CD45 (N, P) in ischemic tissue in BM-chimeric (I, J, M, N) and non-chimeric mice (K, L, O, P) 24 hours after pMCAO. N.D, none detected. Scale bars: 200 um (A), 10 um (B, C). 50 um (I-P) *P < 0.05, **P < 0.01, and ***P < 0.001.From: Clausen BH, Lambertsen KL, Babcock AA, Holm TH, Dagnaes-Hansen F, Finsen B. Interleukin-1beta and tumor necrosis factor-alpha are expressed by different subsets of microglia and macrophages after ischemic stroke in mice. J Neuroinflammation. 2008 Oct 23;5:46.)
CD11b, Monoclonal Antibody (Cat# AAA12185)
Full Name
RAT ANTI MOUSE CD11b
Gene Names
Itgam; CR3; CR3A; MAC1; Cd11b; Ly-40; Mac-1; Mac-1a; CD11b/CD18; F730045J24Rik
Applications
Immunohistochemistry, Flow Cytometry, Immunofluorescence, Immunoprecipitation
Pricing


 Application Data
(Published customer image Infiltration of GFP+ BM-cells in infarct and peri-infarct regions. (A-B) Dot plots of viable macrophages/granulocytes (CD11b+CD45high, top right quadrants) and microglia (CD11b+CD45dim, bottom right quadrants) in cortex from BM-chimeric unmanipulated mice and mice exposed to pMCAO. (C) Bar graph showing mean numbers of CD11b+CD45dim microglia and CD11b+CD45high macrophages/granulocytes in BM-chimeric mice 24 hours after pMCAO, subdivided based on expression of GFP (n = 5). Approximately 92% of of the CD45high population were GFP+. (D) Estimation and comparison of mean numbers of CD11b+CD45dim microglia in non-chimeric (n = 10) versus BM-chimeric mice (n = 5) 24 hours after of pMCAO shows significantly fewer CD11b+CD45dim microglial cells in irradiated mice. (E) Overview, showing distribution of infiltrating GFP+ BM-derived cells into infarct (IF) and peri-infarct (P-IF) regions 24 hours after pMCAO. (E-G) By 24 hours, GFP+ single cells (F) and vessel-associated aggregates of GFP+ cells (arrows in G) were observed in infarct and peri-infarct regions. Some of the vessel-associated cells were round, leukocyte-like cells (arrows) while others were elongated cells lining the vasculature (arrow heads in G and in insert). (H) Bar graph showing mean numbers of single GFP+ cells and vessel-associated aggregates of GFP+ cells in ipsi- and contralateral cortex 24 hours after surgery (n = 10). (I-P) Immunohistochemical staining of CD45.1 (I, K), CD45.2 (J, L), IgG2a (M, O) and CD45 (N, P) in ischemic tissue in BM-chimeric (I, J, M, N) and non-chimeric mice (K, L, O, P) 24 hours after pMCAO. N.D, none detected. Scale bars: 200 um (A), 10 um (B, C). 50 um (I-P) *P < 0.05, **P < 0.01, and ***P < 0.001.From: Clausen BH, Lambertsen KL, Babcock AA, Holm TH, Dagnaes-Hansen F, Finsen B. Interleukin-1beta and tumor necrosis factor-alpha are expressed by different subsets of microglia and macrophages after ischemic stroke in mice. J Neuroinflammation. 2008 Oct 23;5:46.)
Application Data
(Published customer image Infiltration of GFP+ BM-cells in infarct and peri-infarct regions. (A-B) Dot plots of viable macrophages/granulocytes (CD11b+CD45high, top right quadrants) and microglia (CD11b+CD45dim, bottom right quadrants) in cortex from BM-chimeric unmanipulated mice and mice exposed to pMCAO. (C) Bar graph showing mean numbers of CD11b+CD45dim microglia and CD11b+CD45high macrophages/granulocytes in BM-chimeric mice 24 hours after pMCAO, subdivided based on expression of GFP (n = 5). Approximately 92% of of the CD45high population were GFP+. (D) Estimation and comparison of mean numbers of CD11b+CD45dim microglia in non-chimeric (n = 10) versus BM-chimeric mice (n = 5) 24 hours after of pMCAO shows significantly fewer CD11b+CD45dim microglial cells in irradiated mice. (E) Overview, showing distribution of infiltrating GFP+ BM-derived cells into infarct (IF) and peri-infarct (P-IF) regions 24 hours after pMCAO. (E-G) By 24 hours, GFP+ single cells (F) and vessel-associated aggregates of GFP+ cells (arrows in G) were observed in infarct and peri-infarct regions. Some of the vessel-associated cells were round, leukocyte-like cells (arrows) while others were elongated cells lining the vasculature (arrow heads in G and in insert). (H) Bar graph showing mean numbers of single GFP+ cells and vessel-associated aggregates of GFP+ cells in ipsi- and contralateral cortex 24 hours after surgery (n = 10). (I-P) Immunohistochemical staining of CD45.1 (I, K), CD45.2 (J, L), IgG2a (M, O) and CD45 (N, P) in ischemic tissue in BM-chimeric (I, J, M, N) and non-chimeric mice (K, L, O, P) 24 hours after pMCAO. N.D, none detected. Scale bars: 200 um (A), 10 um (B, C). 50 um (I-P) *P < 0.05, **P < 0.01, and ***P < 0.001.From: Clausen BH, Lambertsen KL, Babcock AA, Holm TH, Dagnaes-Hansen F, Finsen B. Interleukin-1beta and tumor necrosis factor-alpha are expressed by different subsets of microglia and macrophages after ischemic stroke in mice. J Neuroinflammation. 2008 Oct 23;5:46.)
CD11b, Monoclonal Antibody (Cat# AAA12186)
Full Name
RAT ANTI MOUSE CD11b:RPE
Gene Names
Itgam; CR3; CR3A; MAC1; Cd11b; Ly-40; Mac-1; Mac-1a; CD11b/CD18; F730045J24Rik
Applications
Flow Cytometry
Pricing


 Application Data
(Published customer image Infiltration of GFP+ BM-cells in infarct and peri-infarct regions. (A-B) Dot plots of viable macrophages/granulocytes (CD11b+CD45high, top right quadrants) and microglia (CD11b+CD45dim, bottom right quadrants) in cortex from BM-chimeric unmanipulated mice and mice exposed to pMCAO. (C) Bar graph showing mean numbers of CD11b+CD45dim microglia and CD11b+CD45high macrophages/granulocytes in BM-chimeric mice 24 hours after pMCAO, subdivided based on expression of GFP (n = 5). Approximately 92% of of the CD45high population were GFP+. (D) Estimation and comparison of mean numbers of CD11b+CD45dim microglia in non-chimeric (n = 10) versus BM-chimeric mice (n = 5) 24 hours after of pMCAO shows significantly fewer CD11b+CD45dim microglial cells in irradiated mice. (E) Overview, showing distribution of infiltrating GFP+ BM-derived cells into infarct (IF) and peri-infarct (P-IF) regions 24 hours after pMCAO. (E-G) By 24 hours, GFP+ single cells (F) and vessel-associated aggregates of GFP+ cells (arrows in G) were observed in infarct and peri-infarct regions. Some of the vessel-associated cells were round, leukocyte-like cells (arrows) while others were elongated cells lining the vasculature (arrow heads in G and in insert). (H) Bar graph showing mean numbers of single GFP+ cells and vessel-associated aggregates of GFP+ cells in ipsi- and contralateral cortex 24 hours after surgery (n = 10). (I-P) Immunohistochemical staining of CD45.1 (I, K), CD45.2 (J, L), IgG2a (M, O) and CD45 (N, P) in ischemic tissue in BM-chimeric (I, J, M, N) and non-chimeric mice (K, L, O, P) 24 hours after pMCAO. N.D, none detected. Scale bars: 200 um (A), 10 um (B, C). 50 um (I-P) *P < 0.05, **P < 0.01, and ***P < 0.001.From: Clausen BH, Lambertsen KL, Babcock AA, Holm TH, Dagnaes-Hansen F, Finsen B. Interleukin-1beta and tumor necrosis factor-alpha are expressed by different subsets of microglia and macrophages after ischemic stroke in mice. J Neuroinflammation. 2008 Oct 23;5:46.)
Application Data
(Published customer image Infiltration of GFP+ BM-cells in infarct and peri-infarct regions. (A-B) Dot plots of viable macrophages/granulocytes (CD11b+CD45high, top right quadrants) and microglia (CD11b+CD45dim, bottom right quadrants) in cortex from BM-chimeric unmanipulated mice and mice exposed to pMCAO. (C) Bar graph showing mean numbers of CD11b+CD45dim microglia and CD11b+CD45high macrophages/granulocytes in BM-chimeric mice 24 hours after pMCAO, subdivided based on expression of GFP (n = 5). Approximately 92% of of the CD45high population were GFP+. (D) Estimation and comparison of mean numbers of CD11b+CD45dim microglia in non-chimeric (n = 10) versus BM-chimeric mice (n = 5) 24 hours after of pMCAO shows significantly fewer CD11b+CD45dim microglial cells in irradiated mice. (E) Overview, showing distribution of infiltrating GFP+ BM-derived cells into infarct (IF) and peri-infarct (P-IF) regions 24 hours after pMCAO. (E-G) By 24 hours, GFP+ single cells (F) and vessel-associated aggregates of GFP+ cells (arrows in G) were observed in infarct and peri-infarct regions. Some of the vessel-associated cells were round, leukocyte-like cells (arrows) while others were elongated cells lining the vasculature (arrow heads in G and in insert). (H) Bar graph showing mean numbers of single GFP+ cells and vessel-associated aggregates of GFP+ cells in ipsi- and contralateral cortex 24 hours after surgery (n = 10). (I-P) Immunohistochemical staining of CD45.1 (I, K), CD45.2 (J, L), IgG2a (M, O) and CD45 (N, P) in ischemic tissue in BM-chimeric (I, J, M, N) and non-chimeric mice (K, L, O, P) 24 hours after pMCAO. N.D, none detected. Scale bars: 200 um (A), 10 um (B, C). 50 um (I-P) *P < 0.05, **P < 0.01, and ***P < 0.001.From: Clausen BH, Lambertsen KL, Babcock AA, Holm TH, Dagnaes-Hansen F, Finsen B. Interleukin-1beta and tumor necrosis factor-alpha are expressed by different subsets of microglia and macrophages after ischemic stroke in mice. J Neuroinflammation. 2008 Oct 23;5:46.)
CD11b, Monoclonal Antibody (Cat# AAA12231)
Full Name
RAT ANTI MOUSE CD11b:Low Endotoxin
Gene Names
Itgam; CR3; CR3A; MAC1; Cd11b; Ly-40; Mac-1; Mac-1a; CD11b/CD18; F730045J24Rik
Applications
Immunohistochemistry, Flow Cytometry, Functional Assay, Immunofluorescence, Immunoprecipitation
Pricing


 Application Data
(Published customer image Infiltration of GFP+ BM-cells in infarct and peri-infarct regions. (A-B) Dot plots of viable macrophages/granulocytes (CD11b+CD45high, top right quadrants) and microglia (CD11b+CD45dim, bottom right quadrants) in cortex from BM-chimeric unmanipulated mice and mice exposed to pMCAO. (C) Bar graph showing mean numbers of CD11b+CD45dim microglia and CD11b+CD45high macrophages/granulocytes in BM-chimeric mice 24 hours after pMCAO, subdivided based on expression of GFP (n = 5). Approximately 92% of of the CD45high population were GFP+. (D) Estimation and comparison of mean numbers of CD11b+CD45dim microglia in non-chimeric (n = 10) versus BM-chimeric mice (n = 5) 24 hours after of pMCAO shows significantly fewer CD11b+CD45dim microglial cells in irradiated mice. (E) Overview, showing distribution of infiltrating GFP+ BM-derived cells into infarct (IF) and peri-infarct (P-IF) regions 24 hours after pMCAO. (E-G) By 24 hours, GFP+ single cells (F) and vessel-associated aggregates of GFP+ cells (arrows in G) were observed in infarct and peri-infarct regions. Some of the vessel-associated cells were round, leukocyte-like cells (arrows) while others were elongated cells lining the vasculature (arrow heads in G and in insert). (H) Bar graph showing mean numbers of single GFP+ cells and vessel-associated aggregates of GFP+ cells in ipsi- and contralateral cortex 24 hours after surgery (n = 10). (I-P) Immunohistochemical staining of CD45.1 (I, K), CD45.2 (J, L), IgG2a (M, O) and CD45 (N, P) in ischemic tissue in BM-chimeric (I, J, M, N) and non-chimeric mice (K, L, O, P) 24 hours after pMCAO. N.D, none detected. Scale bars: 200 um (A), 10 um (B, C). 50 um (I-P) *P < 0.05, **P < 0.01, and ***P < 0.001.From: Clausen BH, Lambertsen KL, Babcock AA, Holm TH, Dagnaes-Hansen F, Finsen B. Interleukin-1beta and tumor necrosis factor-alpha are expressed by different subsets of microglia and macrophages after ischemic stroke in mice. J Neuroinflammation. 2008 Oct 23;5:46.)
Application Data
(Published customer image Infiltration of GFP+ BM-cells in infarct and peri-infarct regions. (A-B) Dot plots of viable macrophages/granulocytes (CD11b+CD45high, top right quadrants) and microglia (CD11b+CD45dim, bottom right quadrants) in cortex from BM-chimeric unmanipulated mice and mice exposed to pMCAO. (C) Bar graph showing mean numbers of CD11b+CD45dim microglia and CD11b+CD45high macrophages/granulocytes in BM-chimeric mice 24 hours after pMCAO, subdivided based on expression of GFP (n = 5). Approximately 92% of of the CD45high population were GFP+. (D) Estimation and comparison of mean numbers of CD11b+CD45dim microglia in non-chimeric (n = 10) versus BM-chimeric mice (n = 5) 24 hours after of pMCAO shows significantly fewer CD11b+CD45dim microglial cells in irradiated mice. (E) Overview, showing distribution of infiltrating GFP+ BM-derived cells into infarct (IF) and peri-infarct (P-IF) regions 24 hours after pMCAO. (E-G) By 24 hours, GFP+ single cells (F) and vessel-associated aggregates of GFP+ cells (arrows in G) were observed in infarct and peri-infarct regions. Some of the vessel-associated cells were round, leukocyte-like cells (arrows) while others were elongated cells lining the vasculature (arrow heads in G and in insert). (H) Bar graph showing mean numbers of single GFP+ cells and vessel-associated aggregates of GFP+ cells in ipsi- and contralateral cortex 24 hours after surgery (n = 10). (I-P) Immunohistochemical staining of CD45.1 (I, K), CD45.2 (J, L), IgG2a (M, O) and CD45 (N, P) in ischemic tissue in BM-chimeric (I, J, M, N) and non-chimeric mice (K, L, O, P) 24 hours after pMCAO. N.D, none detected. Scale bars: 200 um (A), 10 um (B, C). 50 um (I-P) *P < 0.05, **P < 0.01, and ***P < 0.001.From: Clausen BH, Lambertsen KL, Babcock AA, Holm TH, Dagnaes-Hansen F, Finsen B. Interleukin-1beta and tumor necrosis factor-alpha are expressed by different subsets of microglia and macrophages after ischemic stroke in mice. J Neuroinflammation. 2008 Oct 23;5:46.)
CD11b, Monoclonal Antibody (Cat# AAA12181)
Full Name
RAT ANTI MOUSE CD11b
Gene Names
Itgam; CR3; CR3A; MAC1; Cd11b; Ly-40; Mac-1; Mac-1a; CD11b/CD18; F730045J24Rik
Reactivity
Human
Applications
Immunohistochemistry, Flow Cytometry, Immunofluorescence, Immunoprecipitation
Pricing
 Application Data
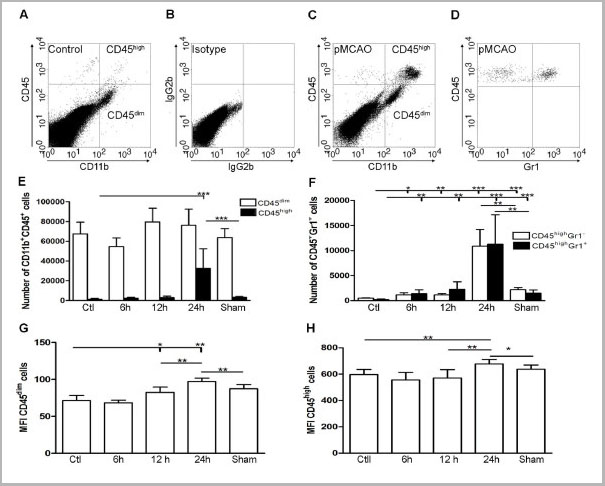
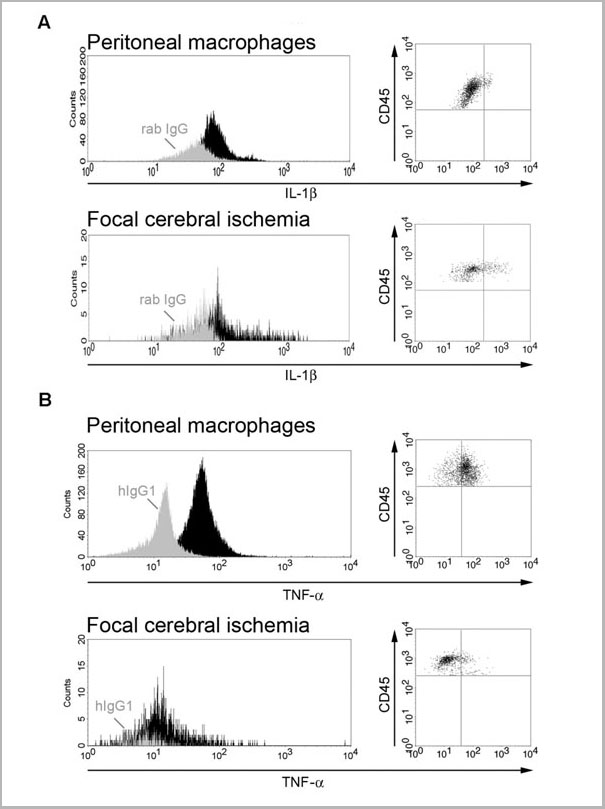
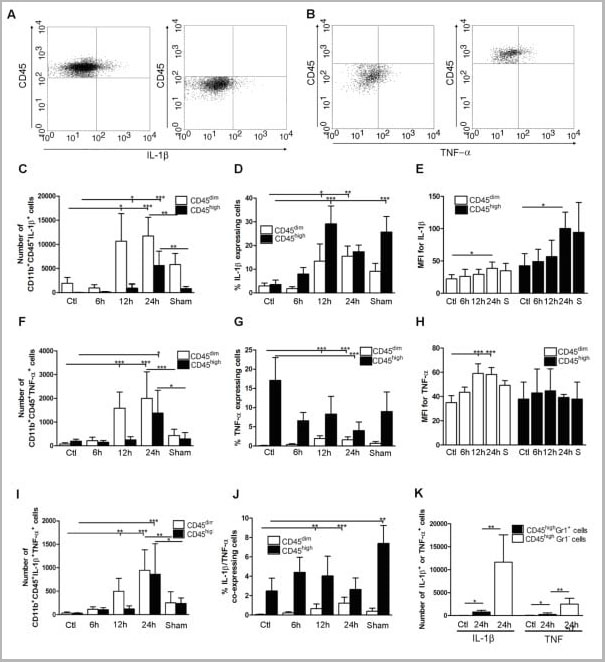
(Published customer image: Cytokine expression in segregated populations of cells following stroke. (A, B) Dot plots showing CD11b+CD45high macrophages/granulocytes (upper right quadrants) and CD11b+CD45dim microglia (bottom right quadrants) expressing IL-1beta (A) or TNF-a (B). (C-J) Bar graphs showing numbers and proportions of IL-1beta (C, D), TNF-a (F, G) and IL-1beta/TNF-a co-expressing (I, J) CD11b+CD45dim microglia and CD11b+CD45high macrophages/granulocytes in unmanipulated control mice (n = 10), in mice 6 (n = 7), 12 (n = 7), or 24 hours after pMCAO (n = 10), and in sham-operated mice 24 hours after pMCAO (n = 7). (E, H) Comparison of the MFI values for IL-1beta (E) and TNF-a (H) in viable CD11b+CD45dim microglia and CD11b+CD45high macrophages/granulocytes in unmanipulated mice, in mice 6, 12, or 24 hours after pMCAO, and in sham-operated mice 24 hours after pMCAO. Macrophages/granulocytes express significantly more IL-1beta than do microglial in unmanipulated mice, in mice 6, 12, or 24 hours after pMCAO, and in sham-operated mice 24 hours after pMCAO (E), whereas microglial cells express significantly higher levels of TNF-a than do macrophages/granulocytes at 12 h and 24 hours, and in sham-operated mice 24 hours after pMCAO (H). (K) CD11b+CD45highGr1- macrophages and not CD11b+CD45highGr1+ granulocytes are the main producers of IL-1beta and TNF-a 24 hours after pMCAO. *P < 0.05, **P < 0.01, and ***P < 0.001.From: http://www.jneuroinflammation.com/content/5/1/46.)
Application Data
(Published customer image: Cytokine expression in segregated populations of cells following stroke. (A, B) Dot plots showing CD11b+CD45high macrophages/granulocytes (upper right quadrants) and CD11b+CD45dim microglia (bottom right quadrants) expressing IL-1beta (A) or TNF-a (B). (C-J) Bar graphs showing numbers and proportions of IL-1beta (C, D), TNF-a (F, G) and IL-1beta/TNF-a co-expressing (I, J) CD11b+CD45dim microglia and CD11b+CD45high macrophages/granulocytes in unmanipulated control mice (n = 10), in mice 6 (n = 7), 12 (n = 7), or 24 hours after pMCAO (n = 10), and in sham-operated mice 24 hours after pMCAO (n = 7). (E, H) Comparison of the MFI values for IL-1beta (E) and TNF-a (H) in viable CD11b+CD45dim microglia and CD11b+CD45high macrophages/granulocytes in unmanipulated mice, in mice 6, 12, or 24 hours after pMCAO, and in sham-operated mice 24 hours after pMCAO. Macrophages/granulocytes express significantly more IL-1beta than do microglial in unmanipulated mice, in mice 6, 12, or 24 hours after pMCAO, and in sham-operated mice 24 hours after pMCAO (E), whereas microglial cells express significantly higher levels of TNF-a than do macrophages/granulocytes at 12 h and 24 hours, and in sham-operated mice 24 hours after pMCAO (H). (K) CD11b+CD45highGr1- macrophages and not CD11b+CD45highGr1+ granulocytes are the main producers of IL-1beta and TNF-a 24 hours after pMCAO. *P < 0.05, **P < 0.01, and ***P < 0.001.From: http://www.jneuroinflammation.com/content/5/1/46.)
CD45, Monoclonal Antibody (Cat# AAA11896)
Full Name
RAT ANTI MOUSE CD45
Gene Names
Ptprc; loc; B220; Cd45; L-CA; Ly-5; T200; CD45R; Lyt-4
Applications
Immunohistochemistry, Flow Cytometry, Immunofluorescence, Immunoprecipitation
Pricing